Indice del volumen
Volume index
Comité Editorial
Editorial Board
Comité Científico
Scientific Committee
- Low-dimensional chaotic dynamics may be present in measles data17-22.
- Periodic components are present in measles dynamics13, 15, 16, 18.
- There are dynamical transitions and bifurcations during the epidemic17, 20.
NONLINEAR PROPERTIES OF MEASLES EPIDEMIC DATA ASSESSED WITH A KERNEL NONPARAMETRIC IDENTIFICATION APPROACH
José Luis Hernández Cáceres1Lourdes Hernández Martínez2, Maicel Pérez Monzón1,
and Luis García Domínguez3
1 Center for Cybernetics Applications to Medicine (CECAM). Havana Medical University and 2 Havana Agricultural University, Havana, Cuba.
3 Hospital for Sick Children, Brain and Behaviour Programme and Division of Neurology, Toronto, Canada.
cacerjlh@cecam.sld.cu
Rev Electron Biomed / Electron J Biomed 2006;2:7-13.
Comment of the reviewer Mario Arturo González Marińo MD. Profesor de Epidemiología, Facultad de Medicina, Fundación Universitaria San Martín. Bogotá, Colombia
Comment of the reviewer David Montańo Inturias MD. MPH. Novib Oxfam Netherlands. Projet du Nord Kivu. RDC
ABSTRACT
Kernel nonparametric nonlinear autoregression was applied to measles data from the pre-vaccination era (1944-1966). A slowly sliding time window covered 20 overlapping segments of the series. In the case of data from Birmingham the order of the model was higher than 22 for all windows and the reconstructed noise free realizations were periodic with the most probable period being equal to 3 years, though values of 2, 4 and 6 years were also obtained.
For London data 6 windows were with low orders (below 5). Low order noise free realizations were chaotic. The rest presented periodic solutions corresponding to 1, 2, and 3-years cycles. Our results are consistent with views about dynamical transitions among measles data. The method is reliable and puts practically no restrictions regarding data properties. We recommend its use for further exploration of epidemic data from different origin.
Keywords: Nonlinear nonparametric autoregression, epidemics, measles, bifurcation, chaos.
RESUMEN
PROPIEDADES NO LINEALES DE DATOS EPIDEMIOLÓGICOS DE SARAMPIÓN EVALUADAS MEDIANTE UN ENFOQUE DE IDENTIFICACIÓN NO LINEAL POR NÚCLEOS.
Se aplicó un método de auto-regresión no lineal por núcleos a datos de incidencia de sarampión correspondientes a la época previa a la vacunación (1944-1966). Una ventana de tiempo que se desplazaba lentamente cubrió 20 segmentos de serie temporal que se solapaban. En el caso de los datos correspondientes a Birmingham el orden del modelo era mayor de 22 para todas las ventanas y las realizaciones libres de ruido reconstruidas eran periódicas con la duración del periodo más probable igual a 3 ańos, aunque también se obtuvieron valores de 2, 4 y 6 ańos.
Para los datos de Londres, se observaron 6 ventanas con órdenes inferiores a 5. Las realizaciones libres de ruido con órdenes bajos eran caóticas. El resto de las ventanas mostraron ciclos de 1, 2 y tres ańos. Nuestros resultados son concordantes con la idea de la presencia de transiciones de fase en series de sarampión. El método es confiable y no impone restricciones respecto a la naturaleza de los datos. Recomendamos su uso para la exploración ulterior de datos epidemiológicos de diversa naturaleza.
Palabras clave: Auto-regresión no lineal no paramétrica, Epidemias, Sarampión, Bifurcación, Caos.
Palabras Clave:
INTRODUCTION
One of the early claims by chaos-theory pioneers was the presence of low dimensional chaos in epidemic data dynamics1, 2.
Further developments in nonlinear analysis made it clear that to declare a time series from the real world as chaotic is not trouble-free. Yet, we still lack a reliable "0-1" test for chaos3. The possibility of a chaotic nature for epidemics data is of interest not only for theoreticians. With the developments in chaos control techniques4, 5 it would be possible to outline a strategy for transmissible disease control that could save both lives and resources.
We do recognize that the topic is still open and the final answer seems to appear only with the application of methods not formalized thus far6. On the other hand, the use of time series analysis approaches that were proven as proficient in other areas may be justified.
In this paper we apply a nonlinear identification approach with kernel nonparametric autoregression to the study of known data from measles corresponding to different cities before the vaccination campaign. The main attention has been paid to finding the optimal order of a nonlinear nonparametric autoregressive model and to characterize the corresponding noise-free realizations.
If we were able to find that the optimal order is lower than five and the noise free realization is erratic in appearance, then we have good chances to assume that the time series' "skeleton" is chaotic7. In that case we speak about a nonlinear stochastic process with a chaotic attractor8.
Our results suggest that measles dynamics changes apparently following a dynamical bifurcation scenario. In some instances, episodes of low-dimensional chaotic dynamics may appear.
MATERIALS, METHODS AND DEFINITIONS
Data. Measles epidemic data corresponding to fortnight measles incidence from pre-vaccination era (1944-1966; 598 data points) among 60 cities from England and Wales were downloaded from the sitehttp://www.zoo.cam.ac.uk. Other data from NYC, and Copenhagen were downloaded from http://www.zoo.ufl.edu/bolker/measdata.html. Data corresponding to each city were saved as ASCII files and submitted to further analysis. After a preliminary analysis with a larger set data from London and Birmingham were chosen for a more detailed study.
Kernel Nonlinear Autoregressive Identification (KNLARI). The rationale of our approach is to apply a non-linear identification approach to time series data. Non-linear identification has proven to be adequate for the analysis of short duration (180-500 data points) time series whose dynamical nature is unknown7, 8. The method allows separating the deterministic and stochastic components of a stochastic non-linear system. In particular, most of the known classical chaotic attractors have been mimicked by this method8, 9.
KNLARI can be viewed as an extension of classical linear autoregressive estimation to the non-linear case, but also as an extension of classical chaos theory approach to the case when the non-linear system is fed with innovation noise10, 11. Since we are trying to track possible changes in dynamics as time passes, it is necessary to use the smallest time window duration that can reliably detect an autoregressive function. Unlike heart rate variability data previously studied using this method12, measles data seem to behave as stationary processes. As it can be seen from figure 12, the standard deviation of these time sequences apparently reach a nearly constant value for window lengths higher than 250 data points. We selected for our analysis time windows corresponding to 280 fortnights.
Twenty sliding time windows (280 data points long each) were consecutively analyzed. The first window started at the 1st data point, the second at 11th, the third one started at the 21st data point of the complete series. The last window covered from the 201st to the 489th data points. According to the schedule selected, less than 5% of the data points are renewed in each adjacent estimation.
For KNLARI to each window the following non-linear autoregressive model was fit:
I n = f(In-1,In-2,…,In-m) +  n (1)
n (1)
Where In-1,In-2,…,In-m , are the (n-1)th, (n-2)th,…,(n-m)th measles incidence values (number of newly reported cases in the fortnight) in the series.
In (1), f is a multivariate non-linear function relating the nth incidence value to the k preceding values in the sequence. Under our assumptions, {n} corresponds to a random, independent, identically distributed variable. The parameter m is the order of the non-linear autoregressive model. The function f is estimated non-parametrically13.
According to this method, the estimate at an arbitrary point (Zt-1, Zt-2,…,Zt-m) of the state space is obtained nonparametrically as a weighted average of neighboring data.
 (2)
(2) The bandwidth parameter h determines the weight corresponding to each neighboring point in the phase space. Thus, if h is too large we have just averaging, whereas for a too small h noise will be incorporated into the deterministic function. A minimal cross validation error criterion has been used for selecting the bandwidth parameter8, 10, 11. The determination of the optimal order of an autoregressive model is a difficult task even for parametric models. The introduction of likelihood criteria is an attempt to penalize the good prediction at expenses of parameter quantity inflation7. For that purpose a cross validation criterion was also used8, 10, 11. The possible space for optimal order search spanned from m=2 to m=25. Higher values were not considered as we regarded them unrealistic for windows with durations of 280 data points. For a description of the use of cross validation in kernel non-linear nonparametric autoregression the reader is referred to14.
After performing KNLARI both the optimal order of the model and a noise free realization (NFR) were stored. For obtaining a noise-free realization, formula (2) was recurrently applied to an initially random set of values. After several estimations, the transient component of the NFR dies out. Figures 3 and 4 provide examples of how the NFR goes beyond the initial transient phase and enters into a periodic attractor.
A phase portrait can be obtained in a plot of current versus one or two previous values.
RESULTS
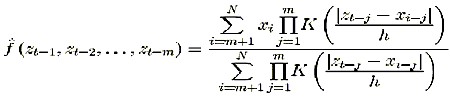
Birmingham data. Birmingham measles time series is represented in figure 1. The optimal orders corresponding to the 20 sliding windows analyzed are shown in figure 2. The fact that optimal order values were between 22 and 25 might point to the absence of low dimensional chaos in this series.
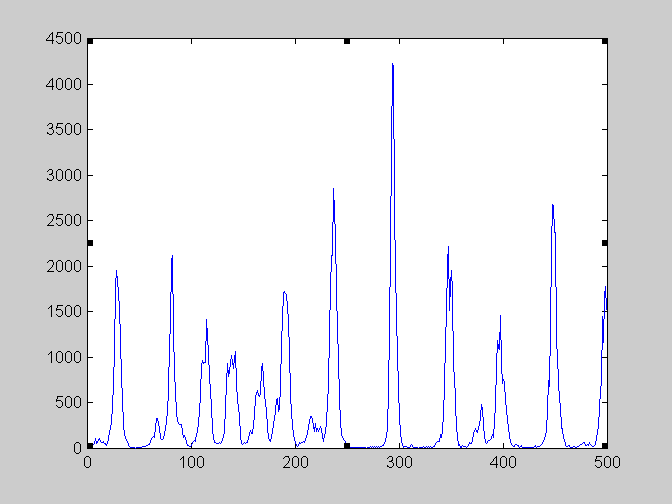
Figure 1. Birmingham measles data. First data point corresponds to the number of new cases of measles declared on the first fortnight of 1944. The last point represents last fortnight of 1966 |

Figure 2. Optimal orders for Birmingham measles data |
All but one of the noise-free realizations were periodic. One NFR corresponded to a flat time series, which is typical of a point attractor. However, there were differences among them as to the shape of the periodic NFR. Figures 3-4 illustrate some the periodic NFR obtained. In an attempt to characterize the diversity of the NFR we estimated the periods of the obtained NFR. The resulting histogram is shown in figure 5. As apparent, the most frequent value corresponds to a period of 3 years (about 78 fortnights). Two NFR doubled this value (6 years). One NFR had a period of 2 years (26 fortnights), three NFR had a period of 4 years and 3 NFR had a period of 8 years, whereas another NFR had a period of 7 years.
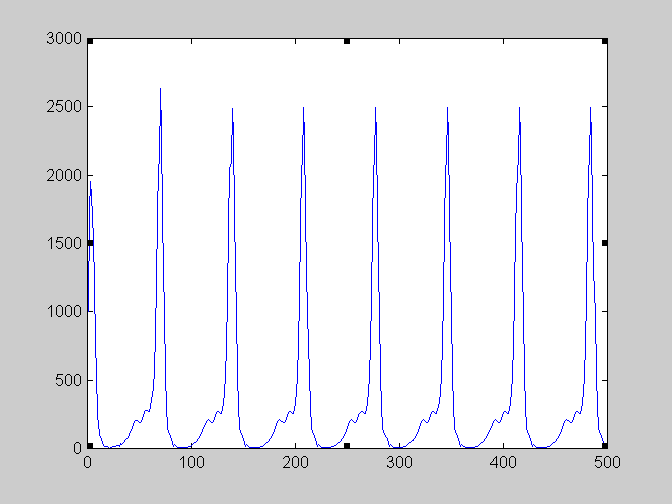
Figure 3. Noise free realization (NFR) # 1. Birmingham data. |
Figure 4. NFR # 12. Birmingham data |
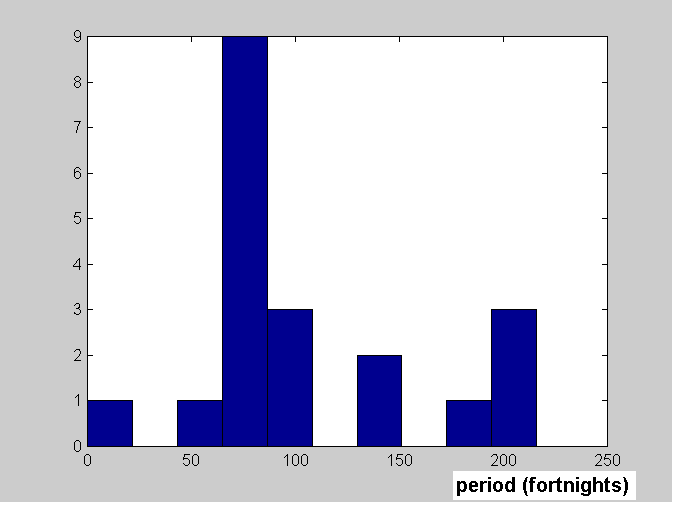
Figure 5, Histogram of NFR periods. Birmingham data. |
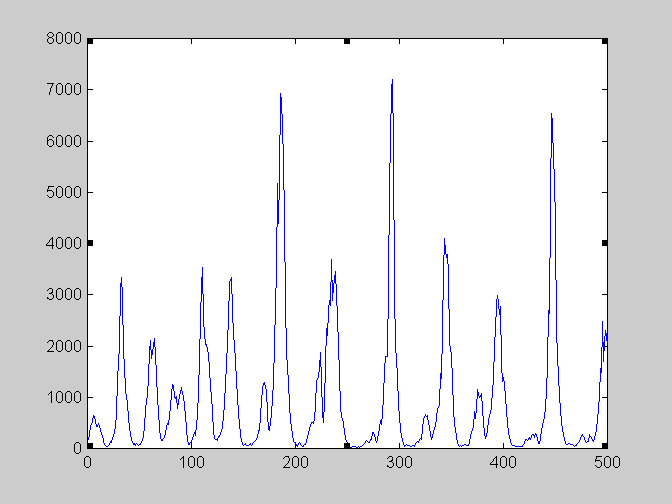 Figure 6, London measles data. Legend: see figure 1. |
London data. The series of London measles data is represented in figure 6. Unlike Birmingham data, optimal orders changed as the time windows shifted (Figure 7). Not surprisingly, some NFR corresponding to low orders presented a chaotic appearance. This is illustrated in figure 9. As illustrated in figure 10 and 11 the phase portrait did correspond to a chaotic attractor. Periodic NFRs did show different degrees of irregularities (See figure 8). More than 70 % of the periods of nonchaotic NFR grouped around 1, 2 and 3 years.
 Figure 7, London Measles data. Optimal orders |
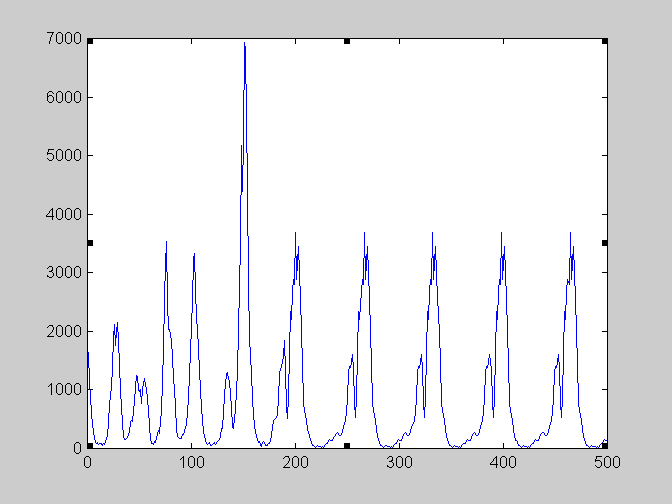 Figure 8, London Measles data, NFR #1 |
 Figure 9, London Measles data, NFR # 9 |
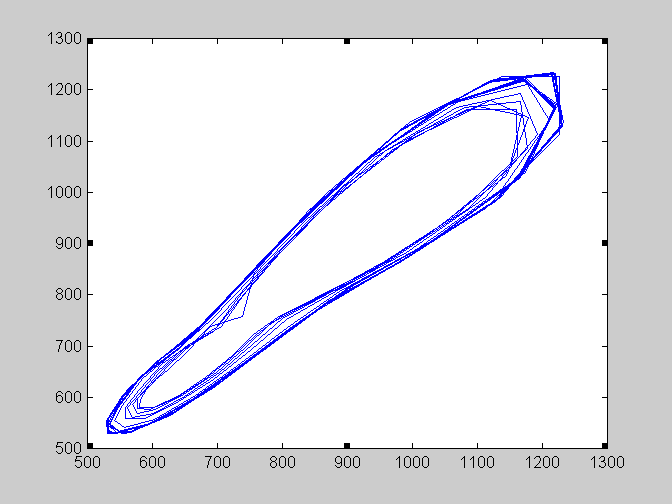 Figure 10, NFR #9 London. Phase portrait of the non-transient region. |
 Figure 11, Detail from previous figure. London measles data. Notice the absence of line crossings. |
 Figure 12, No evidence for nonstationarity. London measles data. Axes: Time series standard deviation vs. window length. |
DISCUSSION
Here we provided few examples of the application of kernel nonparametric auto regression to measles data. As our results revealed for measles data from the pre-vaccination era the most probable scenario is a high-order NFR with a complex periodic pattern. However, sliding the time window in less than 4% leads to changes in the NFR pattern. In the case of Birmingham data, however, the pattern mainly remained as a periodic one. In the case of London data small changes in the data can lead to a radical change from a high-order- to a low-order NFR with periodicities or even chaos. The approach selected here of slowly moving the time window provided the possibility to detect sudden changes in the dynamics within a relatively short time series. The fact that the cyclic NFR had periods in multiples of 1 year cycles points to the reliability of the obtained results, especially if one assumes that no information about circannual periodicities was introduced into the system. On the other hand, the interpretation of the data is difficult, since sudden changes in the dynamics are being observed when as much as 95% of the points used in the estimation remained common. This apparently supports the idea about the coexistence of several attractors in measles dynamics15. This could be a consequence of spatial heterogeneity of data that is not taken into account in the global series16. Nonetheless, the possibility of real bifurcations seems to be the more reliable, since the slight effect that changing less than 5% of the data points can add to the estimation of a function leads to such changes as doubling the period of a limit cycle or even a transition to chaos. By the classical definition, a bifurcation is a sudden change in the dynamics when a parameter of the dynamical system changed extremely slightly7.
Our data are consistent with results from other authors. In particular we obtained that.
Both mechanistic17-21 and data-driven18 models have been applied for characterizing measles dynamics. Each approach presents both merits and drawbacks. Apparently, semimechanistic models outperform both20. Our conviction is, however, that while dealing with a nonlinear system whose properties are not completely elucidated, making rigid forehand assumptions is risky. In our opinion, the best virtue of KNLARI is that assumptions here are reduced to a minimum. As resulted, the implementation of this approach to the study of measles data allowed extracting information that is both meaningful and concordant with literature reports. We consider that this approach might be particularly useful for initial stages of raw data exploring. Combining it with realistic assumptions may better contribute to the management of epidemics, a paradoxically major task of the post modern era6.
Acknowledgements: Authors thank Profs. Pedro Valdés Sosa and Julian Chela-Flores for motivating us to carry on with this research. We thank Prof. B. M. Bolker for helping us with data location. JLHC is a Senior Associate at the Abdus Salam International Center for Theoretical Physics in Trieste, Italy, where part of this work was done. This Paper is dedicated to Dr. Osvaldo Hernández on his 60th birthday.
REFERENCES
- 1. Schaffer WM, Kot MNearly one dimensional dynamics in an epidemic. J Theor Biol. 1985 Jan 21;112:403-27.
2. Sugihara G, Grenfell B, May RM. Distinguishing error from chaos in ecological time series. Philos Trans R Soc Lond B Biol Sci. 1990;330:235-51.
3. Hu J, Tung WW, Gao J, Cao Y. Reliability of the 0-1 test for chaos. Phys Rev E Stat Nonlin Soft Matter Phys. 2005 Nov;72(5 Pt 2)
4. G Sugihara, W Allan, D Sobel, and K D Allan. Nonlinear control of heart rate variability in human infants. Proc Natl Acad Sci U S A. 1996;93:2608-2613
5. I. B. Schwartz, L. Billings, E. M. Bollt. Dynamical epidemic suppression using stochastic prediction and control. Physical Review E 70 (4): Art. No. 046220. OCT 2004
6. J. Stark and K. Hardy. Chaos. Useful at last?. Science 2003;301:1192-1193, .
7. H. Tong. Nonlinear Time Series Analysis. Oxford University Press. 1990.
8. Valdés S P, Bosch J, Jiménez J C, Trujillo N, Biscay R, Morales F, Hernández-Cáceres J L, Ozaki T. The statistical identification of non-linear brain dynamics: A progress report. In: Non-linear Dynamics and Brain Functioning. Pradhan N., Rapp P., Sreenivasan E. (Eds.), Nova Science Publishing. 1999,278-284.
9. Fumikazu Miwakeichi. Characterization of Spike & Wave Signals in epileptic EEG: A non-linear non-parametric time series approach. Ph D. Thesis. Tokyo, 2001
10. Hernandez Cáceres JL, Biscay R, Grave de Peralta R, Jimenez JC: Measuring the dissimilarity between EEG recordings through a non-linear identification approach. Int J. Biomed Computing. 1994;26:256-262.
11. Hernandez Cáceres JL, Valdes S P, and Vila P: The spike and wave EEG activity modelled as a stochastically perturbed limit cycle. NeuroReport. 1996;28:164-170.
12. Hernández Cáceres JL, Foyaca Sibat H, Hong R, Garcia L, Sautié M, Namugowa V. Towards the estimation of the fractal dimension of heart rate variability data. Electron J Biomed 2004;1:4-15.
13. Tjostheim D, Auestad B. Nonparametric identification in non-linear time series: Projections. JASA 1994;79:1398-1402
14. Haerdle W (1993) Applied Nonparametric Regression. Cambridge University Press.
15. P P Kanjilal and J Bhattacharya. Revisited Measles and Chickenpox Dynamics through Orthogonal Transformation. J theor Biol. 1999;197:163-174
16. Yingcun Xia, Ottar N. Bjřrnstad, and Bryan T. Grenfell Measles Metapopulation Dynamics: A Gravity Model for Epidemiological Coupling and Dynamics. The American Naturalist. 2004;164:267-281
17. Earn DJ, Rohani P, Bolker BM, Grenfell BT. A simple model for complex dynamical transitions in epidemics. Science. 2000;287:667-70
18. Sugihara G, Grenfell B, May RM. Distinguishing error from chaos in ecological time series. Philos Trans R Soc Lond B Biol Sci. 1990;330:235-51.
19. Bolker BM, Grenfell BT. Chaos and biological complexity in measles dynamics.Proc Biol Sci. 1993;251:75-81.
20. S. P. Ellner, B. A. Bailey, G. V. Bobashev, A. R. Gallant, B. T. Grenfell, D. W. Nychka Noise and Nonlinearity in Measles Epidemics: Combining Mechanistic and Statistical Approaches to Population Modeling. American Naturalist 1998;151:425-440
21. Tidd CW, Olsen LF, Schaffer WM The case for chaos in childhood epidemics. II. Predicting historical epidemics from mathematical models. Proc Biol Sci. 1993;254:257-73
22. Mauricio Canals L, Rigoberto Solís. Geometría de los sistemas vivos y su importancia en Medicina. Rev Méd Chile. 2005;133:1097-1107
The study and analysis of epidemics has been of key importance in
Epidemiology. It has been not only the cause but also spread, course and
control of disease in order to develop public health activities. Thus, changes in patterns of epidemics from regular cycles to irregular, possibly chaotic epidemics, observed throughout the century before this has gotten a particular interest. Epidemiology has benefited greatly from physics and statistics to understand these changes in order to provide control of communicable diseases. Nonlinear dynamics analysis used to understand some living systems is going to verify the chaotic nature of infectious diseases, the knowledge of its dynamics, comparison between them and the estimation of the losing information rates of the agent and host1.
Kernel nonlinear autoregressive identification may contribute to the management of epidemics like it is considered by this paper.
REFERENCE: 1.- Canals L, Mauricio and Labra S, Fabián Análisis no-lineal de la dinámica de enfermedades infecciosas en Chile. Rev. Med. Chile. 1999;127:1086-1092
Most of the statistical procedures found in the literature use the estimation of one or more parameters of the population originating the samples. For instance, the t-test uses one sample to estimate the value of one variable in the population, where the sample was taken from; provided the distribution in that population is a normal one. Tests of this kind are called parametric tests.
Another group of tests which are not based on the estimation of distribution parameters are the so called non parametric tests.
One interest - among others- in this article lies on its contribution to the long-standing controversy, about the usefulness of these last ones; according to most of the authors, parametric tests are robust enough in most of the cases, and the non parametric tests are not useful really. On the other hand, other authors believe that the non parametric tests are superior to the parametric tests due to the fact that they are independent of the distribution.
Besides our opinion upon the subject, it is always important to be acquainted with non parametric procedures, as well as their rationale.
These tests occupy a very important place in the experimental literature and they merit to be known
* Corresponding author:
José Luis Hernández Cáceres.
Received, February 2, 2006.
Comment of the reviewer reviewer Mario Arturo González Marińo MD. Profesor de Epidemiología, Facultad de Medicina, Fundación Universitaria San Martín. Bogotá, Colombia
Comment of the reviewer David Montańo Inturias MD. MPH. Novib Oxfam Netherlands. Projet du Nord Kivu. RDC
Epidemiology and biostatistcs have become unavoidable tools in decision making to contribute towards the solution of health problems.
In this article, the authors suggest and demonstrate - through a retrospective data exploration about measles - that the kernel non parametric test is a trustworthy tool in epidemiololgy.
CECAM-ISCMH, Calle 146, Nş 2501 esquina a 31, Cubanacán, Playa.
La Habana, Cuba. CP 10400.
Mail: cacerjlh @ cecam.sld.cu
Published, March 27, 2006.