Indice del volumen Volume index
Comité Editorial Editorial Board
Comité Científico Scientific Committee
- Be a set of N linearly cities with identical populations, all evenly located at the nodes of a linear array being
 the distance between neighbouring cities.
- Al one end of the linear array, an epidemic may start. The time series for incidence is identical to that factually observed for the city of Preston.
- Be that the epidemics spreads into neighbouring cities at a speed equal to /1. This means that neighbouring cities display the same incidence pattern shifted in time by one time unit (e. g. one fortnight).
FIRST DIGIT DISTRIBUTION IN SOME BIOLOGICAL DATA SETS. POSSIBLE EXPLANATIONS FOR DEPARTURES FROM BENFORD'S LAW.
José Luis Hernández Cáceres, Jorge Luis Pollo García, Carlos M. Martínez Ortiz, and Luis García Domínguez*
Center for Cybernetics Applications to Medicine, Havana, Cuba *Hospital for Sick Children, Toronto, Canada
cacerjlh @ infomed.sld.cu
Rev Electron Biomed / Electron J Biomed 2008;1:27-35
Comment of the reviewer Prof. José María Eirós Bouza. MD. PhD. Professor of Microbiology. Faculty of Medicine. University of Valladolid. Valladolid. Spain.
Comment of the reviewer Prof. Sorana D. Bolboaca MD. PhD. "Iuliu Hatieganu". University of Medicine and Pharmacy Cluj-Napoca. Cluj. Romania.
SUMMARY
Aim: To explore whether the first digit law (FDL) is abided by data sets from biological origin.
Materials and Methods: Data were collected from different sources, including gene data length for bacteria, pre-vaccination measles incidence data and absolute values from human MEG recordings. First digit frequencies were computed and compared to predictions from FDL. Simulations included a simple model for two-dimensional epidemics spread and a randomly set upper bound model aimed to explain the behaviour of MEG data.
Results: We observed that FDL is obeyed in a case of epidemic data reported at a putative focus of spread (pre-vaccination measles incidence for Preston, England). However, peculiar departures were observed for gene length distribution in microorganisms, magneto-encephalograms (MEG), and epidemic data pooled from large geographical regions.
Conclusions: Simulation studies revealed that averaging data on a scenario of propagating waves can explain some of the observed distortions from FDL. This could help to understand the behaviour of epidemics data. A randomly set upper bound model (RUBM) can likely explain the observed behaviour of MEG data. Explanation for gene length data behaviour requires further theoretical work.
KEY WORDS: First digit law, Epidemics, Magnetoencephalogram, Genes.
RESUMEN
Objetivos: Explorar si la ley del primer dígito (LPD) se cumple en datos de origen biológico.
Materiales y Métodos: Se analizaron datos tomados de diferentes fuentes que incluían longitud de genes en bacterias, datos de incidencia de sarampión en la era pre-vacunación y valores absolutos de MEG registrados en humanos. Las frecuencias de aparición del primer dígito se comparaban con las predicciones teóricas de la LPD. Se realizaron simulaciones para modelar la propagación bidimensional de una epidemia y un modelo con cota superior aleatoria para explicar la conducta de los datos de MEG.
Resultados: Se observó que la LPD se cumple en el caso de datos de una epidemia reportados desde un presunto sitio de propagación (incidencia de sarampión en la era pre-vacunación en Preston, Inglaterra). Sin embargo, se aprecian no-correspondencias peculiares en el caso de la distribución de la longitud de genes en microorganismos, magneto-encefalogramas (MEG) y una epidemia promediada para una zona geográfica extensa.
Conclusiones: Estudios de simulación mostraron que la promediación de datos en un escenario de ondas que se propagan pudiera explicar algunas de las distorsiones observadas, y esto ayudaría a comprender las características de los datos de epidemias. Un modelo con límite máximo aleatorio pudiera explicar los datos de MEG. La consideración de los datos de longitud de genes requiere de un trabajo teórico ulterior.
PALABRAS CLAVE: Ley del primer digito, Epidemia, Magnetoencefalograma, Genes.
INTRODUCCION
The first digit law (FDL) or Benford's Law lingers among the most intriguing mathematical curiosities1. In 1881 Simon Newcomb noticed that the first pages of logarithmic tables corresponding to digit "1" were dirtier than those for larger digits. From this Newcomb concluded that people prefer to use numbers starting with smaller digits.
An empirical law, based on Newcomb's conclusion that "the first significant digit is oftener 1 than any other digit, and the frequency diminishes up to 9", was formulated for the probability of a given figure to start with the digit k=1, 2 9 as follows2:
P( k)= log(1+1/k) (*)
Thus, according to (*) the probabilities P(1), P(2), and P(9) are, respectively 0.305, 0.17, and 0.045. The law remained unnoticed for almost 60 years. In 1938 the American physicist F. Benford, again noticing the soiled pages of the logarithms table in his university's library, rediscovered the first digit´s law. After rediscovering the relationship between digits, Benford ran tests on more than 20,000 entries from about 20 tables of different statistical data3-6.
An illustration on how diverse the applicability of this law can be is provided in Table I, where empirical distributions for home numbers in Havana streets, the areas of modern countries as well as the fist 1400 numbers of the Fibonacci series are compared with theoretical predictions.
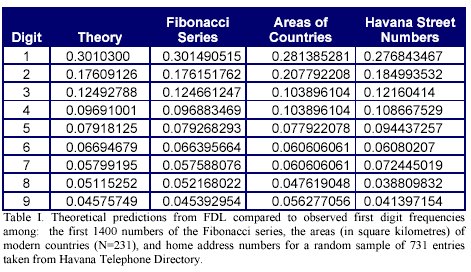
An outstanding feature of the expression (*) is its scale invariance. In practical terms, this means that the same distribution would be obtained if country areas were expressed in square kilometres or square feet as well.
Unlike other "universal" laws, it is hard to find out a theoretical framework leading to a rational explanation of the law. Recent attempts based on "Modern Probability Theory"7 leave open the question of how a strictly deterministic succession, (e. g. the Fibonacci series) converges in an apparently exact way into FDL´s predictions (see table I).
On the other hand, almost untouched has been the question of the possibility for finding clues predicting whether a data set will convey to FDL or not.
This work is aimed at exploring first digit distributions with various data sets of biomedical interest. An attempt to provide some plausible explanation for some of them will also be presented.
MATERIALS AND METHODS
Data: We explored three different data sets: Gene length in published microorganism genomes, measles incidence from pre-vaccination era in England and Wales and magneto-encephalographic (MEG) data from human subjects.
Gene length. The complete genomes from the following species were downloaded via "ftp" from the site ftp://ftp.ncbi.nih.gov/genbank/genomes/Bacteria/ Bordetella parapertussis, Aeropyrum pernix, and Bacillus halodurans. A special "C" program was developed by one of us (CMMO) for estimating each individual gene's length (in bases). Gene length is estimated via substraction of initial and final positions of the corresponding base in the DNA molecule. It works specifically for data in the format of the NCBI data bases. A total of 10464 genes were pooled from the three species.
Measles data. Measles incidence data for England and Wales for the period 1944-1966 were drawn from Registrar General´s Weekly Reports, and are dowloadable as a ".txt" file from the site http://asi23.ent.psu.edu/onb1/publ/bcf/data.html. Data were presented as a 60-column matrix, each column corresponding to one of the 60 cities from England and Wales reported. Columns correspond to each fortnight starting from the first fortnight of 1944 until the last fortnight of 1966.
MEG Data. Magneto-encephalograms from a healthy subject were taken from an apparently healthy male subject using the MEG machine at the HSC in Toronto. Absolute values of magnetic field intensity were collected and submitted to further treatment.
Simulations: First digit distributions were generated from two models. One model attempted to emulate the geographic spread of a "realistic" epidemic from a focus. The second model considered the possible influence of upper bounds on digit distribution. We call the model Random Upper Bound Model (RUBM)
Epidemic spread model: We implemented simulations based on the following very simple model for spreading epidemics.
RUBM: It seems plausible to explore whether the first digit law is a consequence of the finite nature of real data sets. The RUBM assumes that natural numbers span from 1 till an upper bound (for example 250); We call the number 250 "upper bound". For the case of uniform distribution of probability, number 1 will appear with a probability of 111/250=0.44, number 2 appears with 61/250= 0,244, etc. RUBM assumes that the upper bound changes randomly. For each upper bound a number was randomly picked out and 10000 simulations were performed for obtaining a frequency distribution histogram.
RESULTS AND DISCUSSION
Gene length data. In figure 1a, first digit frequencies from gene length data for a total of 10464 genes has been provided.
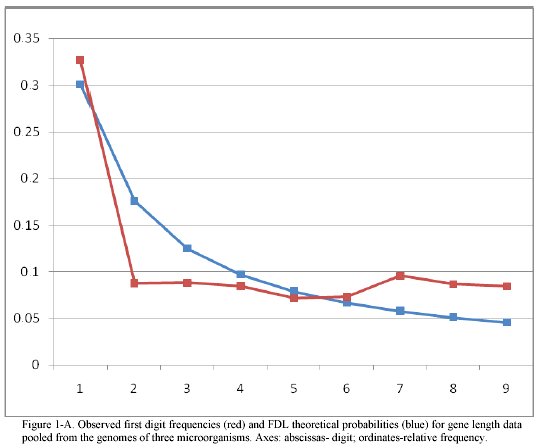
As appreciable, the theoretical distribution from FDL is unlikely for these data. However, eye inspection suggests a tendency for the digit 1 to be the most frequent. Other digits appear in a rather uniform pattern.
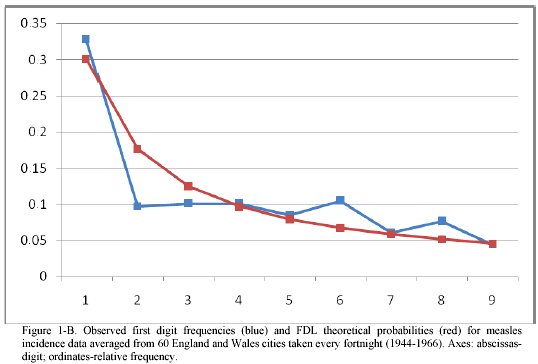
Measles data. In figure 1b, the distribution of first digits is presented for the sum of data collected from all the 60 England and Wales cities from the data set. Less evident than in figure 1a, the tendency to a higher presence of digit 1 compared to other digits is still likely.
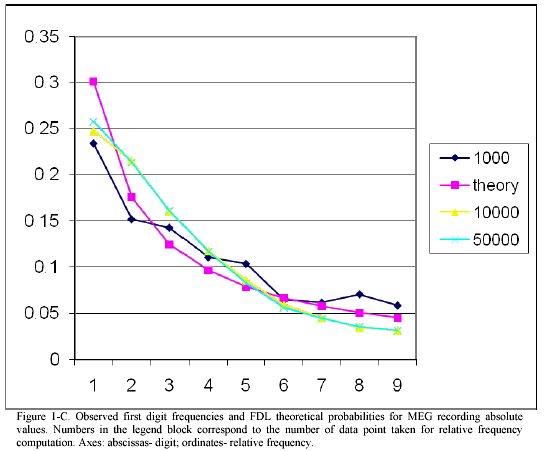
MEG data. As figure 1c reveals, MEG data follow a different pattern, where digit "1" is less frequent, and digits "2" and "3" are more frequent than theoretically expected. Unlike other data gene length data and measles incidence, here we observe a strict monotonous behaviour that seems to become well established as the number of data points exceeds10000.
Travelling waves and the first digit law. In a recent report, Hernandez Caceres et al8 obtained that the port city of Preston was a likely forerunner of measles epidemics in pre-vaccination England. In figure 2 the distribution of digits corresponding to measles incidence for Preston are presented.
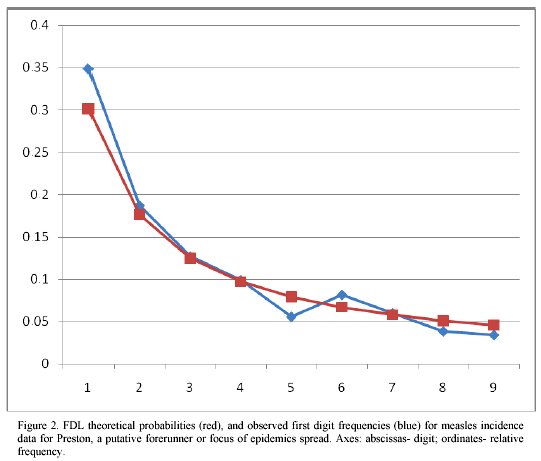
If we compare these results with those of all the 60 cities pooled together, (figure 1b) a better agreement with FDL is suggestive. Comparison of the two images may provide a clue for the departure from FDL distribution observed for some biological data sets. Certain epidemics (measles is an example) behave as propagating waves. If data collected at an original focus of epidemics one can expect to have a data set in agreement with FDL.
Collecting data from a larger area means to obtain a "smeared" picture of more than one wave coexisting in time. In this case, departures from FDL distribution may be observed. We use a very simple epidemic spread model to put this idea to test.
Even when this model may seem very simplistic, without losing generality, some more realistic situations can be handled by just changing the algorithm used in our simulations. Thus the more reliable case of a circularly spreading 2-d epidemic maybe attained by multiplying adjacent columns of the matrix by a progressively increasing factor, etc.
After carrying out our simulations we obtained overall values for different lengths of the array. Then first digit frequencies were estimated for the resulting time series.
Figure 3 illustrates some results from our simulations. As it can be noticed, when a relatively small "area" (N ranging from 1 to 3) is considered, data are in good agreement with FDL.
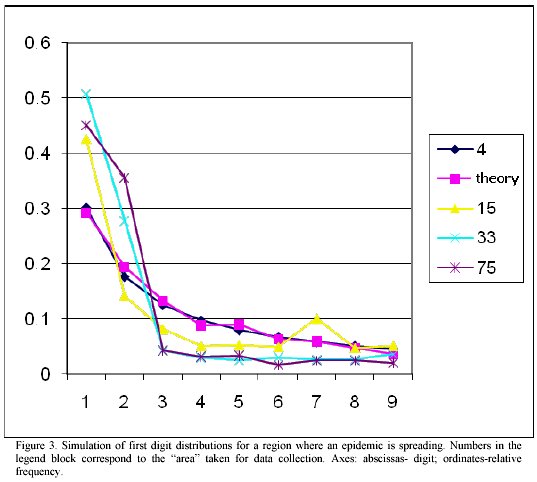
As the number N increases, the distribution changes dramatically. In particular, an increase in the probability for digit "1" takes place. It is not excluded that more shrewd manipulations of the model can mimic other patterns observed with real data.
Thus our simulations revealed that the presence of propagating waves can lead to some of the observed peculiarities of digit distribution with some real data of biological origin.
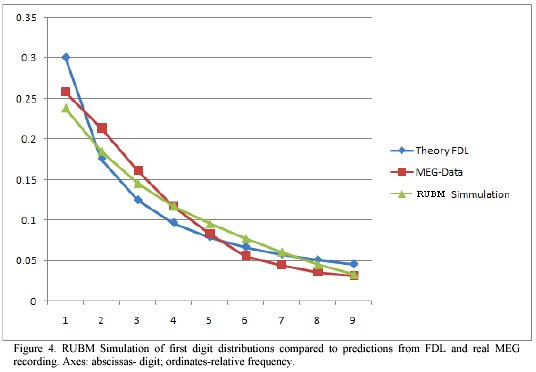
In figure 4 the result of RUBM simulations is compared with predictions from FDL as well as with real MEG data. Apparently, MEG data seem to fit better into the scenario with RUBM
In this section we tried to offer reasons supporting the idea that propagating waves presence might lead to the empirical observations with epidemics incidence data. If it would be proven that this is the case, the degree of agreement of real data with FDL could be used as a criterion for homogeneity of data taken from a certain region.
In the case of MEG data, even when the presence of propagating brain waves is amply documented, the better agreement with a model of randomly set upper bound might suggest that this mechanism is playing a role.
At this moment we did not find yet a plausible explanation for the observed distribution of gene lengths. Perhaps we need a better explanation of what dictates gene length distribution among DNA strands.
Thus we conclude that some biological data sets depart from FDL, usually showing high frequencies for digits "1" and/or "2". In some cases this might be either a consequence of a wave propagation mechanism or a randomly set upper bound distribution.
Acknowledgements: Authors wish to thank MSc Sonia Hernández Camacho for her help in revising the paper.
REFERENCES
- 1.- Torres J, Fernández S, Gamero A, Sola A. How do numbers begin? (The first digit law). Eur J Phys. 2007; 28: L17-L25
2.- Newcomb S. Note on the frequency of the Use of Digits in natural Numbers. Am J Math. 1981; 4: 39-40
3.- Benford F. The Law of Anomalous Numbers. Proc Am Phil Soc 1938;4: 551-572
4.- Sakai H. Frequency distribution of first digit among population Jinko Mondai Kenkyu. 1991; 47: 74-8
5.- Buck B, Merchant AC, Perez SM. An illustration of Benford's first digit law using alpha decay half lives. Eur J Phys 1993;14: 59-63.
6.- Tolle CR, Budzien JL, LaViolette RA. Do dynamical systems follow Benford's law? Chaos. 2000; 10:331-336
7.- Hill T. A Statistical Derivation of the Significant-Digit Law. Statistical Science. 1995; 10: 354-363
8.- Hernández Cáceres JL, Pérez Monzón M, García Domínguez L, Sautié Castellanos M, Hernández Martínez L, Tejera Puente E. Pre vaccination measles outbreaks in England and Wales: Nonlinear Association Analysis suggests a leading Role for Preston. Electron J Biomed 2006;2:7-13.