Indice del volumen Volume index
Comité Editorial Editorial Board
Comité Científico Scientific Committee
RELATION BETWEEN GLUCOLIPID PROFILE AND SMALL INTESTINE HISTOLOGICAL PATTERNS IN DIABETIC RATS EXPOSED TO AN INTERMITTENT DIETARY RESTRICTION
Noriyuki Hisano Ph.D1, Silvana Marisa Montenegro Ph.D1,2
Stella Maris Martinez Ph.D1,2, María Cristina Tarrés Ph.D1,2,
Alberto Enrique D'Ottavio Ph.D1,2
1Medical School, Faculty of Medical Sciences and 2Scientific Researcher Career.
Rosario National University, Rosario. Argentina
aedottavio @ hotmail.com
Rev Electron Biomed / Electron J Biomed 2009;1:24-31
Comment of the reviewer Noemí Gómez Manero MD. PhD. Servicio de Medicina Interna. Complejo Asistencial de Burgos. España.
Comment of the reviewer Dr. Carlos G. Musso MD. Nephrology Department. Hospital Italiano de Buenos Aires. Buenos Aires. Argentina
SUMMARY
The effects of an intermittent and prolonged dietary restriction on biochemical variables and histological small intestinal patterns in 12-month-old male eSMT rats are examined. These spontaneously diabetic animals were separated in two groups after weaning: 10 rats fed ad libitum with standard rat chow and 10 rats fed a restricted diet by deprivation of the same food for 24 hours every 72. At 12 months of age, animals were weighed and euthanized after tail vein bleeding for plasma analysis (glycemia- both fasting and 120 minutes after an oral glucose challenge-, triglyceridemia and total cholesterolemia). Small intestines were removed, weighed and measured in length.
Intestinal specimens were fixed, embedded in paraffin, semi serially cut at 6 µm and stained with PAS-Hematoxilyn and Hematoxilyn-Eosin. Histometry was performed through a linear devise attached to ocular lens and lectin histochemistry was accomplished employing Canavalis ensiformis, Dolichos biflorus, Arachis hypogea, Ulex europaeus-I, Triticum vulgaris, Ricinus communis and Soy Bean (Glicine Max) Agglutinin. Essentially, eSMT rats, a suitable animal model for studying diabetes and/or its complications, revealed at 12 months of age after undergoing the dietary restriction: 1.- An expected improvement in body weight and determined biochemical variables (fasting and after glucose overload glycemias, triglyceridemia and total cholesterolemia) without reaching euglycemic values. 2.- Changes in most of the analyzed histometric patterns with no relevant reflection on morphometric ones, and 3.- No modifications in lectinhistochemical patterns.
KEY WORDS:Diabetes. Rat. Diet. Digestive tube. Biochemistry. Histology
RESUMEN:
Se analizaron los efectos de una restricción dietética intermitente y prolongada sobre variables bioquímicas y patrones histológicos intestinales en ratas macho eSMT. Estos animales, diabéticos espontáneos, fueron separados en dos grupos luego de su destete: 10 fueron alimentados ad libitum con dieta estándar para ratas de laboratorio y 10, sobrellevaron una privación del mismo alimento de 24 horas cada 72. A los 12 meses de edad, los animales fueron pesados y sometidos a eutanasia tras de extraerles sangre de la vena de la cola para análisis plasmáticos (glucemias en ayuno y tras 120 minutos de sobrecarga glúcida, trigliceridemia y colesterolemia total). El intestino delgado fue removido, pesado y medida su longitud.
Los especímenes fueron fijados, incluidos en parafina, cortados a 6 µm de modo semiserial y coloreados con PAS-Hematoxilina y Hematoxilina-Eosina. La histometría fue llevada a cabo mediante un dispositivo lineal ligado al ocular y la lectin histoquímica, empleando Canavalis ensiformis, Dolichos biflorus, Arachis hypogea, Ulex europaeus-I, Triticum vulgaris, Ricinus communis and Soy Bean (Glicine Max) Agglutinin. Esencialmente, las ratas eSMT, un modelo adecuado para el estudio de la diabetes y/o sus complicaciones, revelaron a los 12 meses tras la restricción dietaria seguida: 1.- Una esperada mejoría en el peso corporal, en las glucemias en ayuno y tras sobrecarga glúcida, en la trigliceridemia y en la colesterolemia total aunque sin alcanzar valores euglucémicos. 2.- Cambios en la mayoría de las lectinas analizadas pero sin reflejo sustancial en las variables morfométricas, y 3.- Ausencia de modificaciones en lo que se refiere a la lectinhistoquímica.
PALABRAS CLAVE:Diabetes. Rata. Dieta. Tubo digestivo. Bioquímica. Histología
INTRODUCTION
Diabetes mellitus, long considered a disease of minor significance to world health, is now taking its place as one of the main threats in the 21th.century. The diabetes epidemic, both in developed and developing nations, particularly refers to type 2 diabetes, a metabolic disorder primarily characterized by insulin resistance, relative insulin deficiency and hyperglycemia. Usually associated with overweight and obesity, its prevalence has risen at an alarming pace in the last twenty five years leading to foresee a number of diabetic persons near 366 million for 2030. Consequently, new studies on this topic become strictly necessary1-2.
Distinct animal species have been widely used for investigating the different diabetic types and contributed to the current knowledge on this metabolopathy3-8.
Exceeding induced diabetic animals through diet, alloxan, streptozotocin, surgery and transgenic procedures, those spontaneous or genetically ones (mice and rats) keep being relevant for analyzing the diabetic syndrome6.
Among the spontaneous or genetically animal models for diabetes, the eSMT rat was developed in our laboratory of Biology by crossing eSS rats (a non obese model of type 2 diabetes) with ßrats (a fertile obese model revealing normocholesterolemia, hypertriglyceridemia, and type 2 diabetes). This synthetic line evidences overweight like ß and shows an early beginning of the diabetic syndrome, an enhanced evolution of fasting hyperglycemia and glucose intolerance like eSS9-10.
Continuous or intermittent dietary restriction (DR) diminishes the expression of the diabetic syndrome and has been employed for managing type 2 diabetes and treating obesity11. Likewise, DR also affected the mucosal growth, the morphology and the cell cytokinetics in the small intestine12. Furthermore, DR diminished body and intestinal weights in adult male Lewis rats, put into evidence lower body and liver weights in adult control rats, prevented duodenal hyperplasia and augmentation of ileal villus cell number in 20 months-old -rats, reduced fasting glucose concentrations, triglycerides and cholesterol and increased apoptosis in the small intestine of aging rats13-15.
Although the effects of limiting caloric input depend on the initial age of restriction16-17, chronic caloric restriction augmented longevity, improved insulin sensitivity and lowered lifetime glycemia.
Extending former experiences in eSS and eSMT18-20, the aim of this study was to study the relation between the glucolipid profile and some small intestine histological patterns in male eSMT rats exposed to an intermittent dietary restriction.
MATERIAL AND METHODS
Animals were housed in a room with standard environmental conditions (24ºC, 12 hours light/12 hours dark schedule cycle, air exchange, tap water ad libitum and standard rat chow). 20 eSMT rats were separated in two groups after weaning: 10 rats fed ad libitum (AL) with standard rat chow and 10 rats fed a restricted feeding schedule (R) by deprivation of food for 24 hours every 72.
At 11 months of age, animals were placed in metabolism cages. After a 5 - day adaptive period and during 10 days, food intake and body weight were determined for calculating the total food intake, the mean body weight and the relative food intake (mg/100 g body weight).
At 12 months of age, animals were weighed (BW) and euthanized after tail vein bleeding for plasma analysis (glycemia- both fasting - G0 - and 120 min after an oral glucose overload - G120 -, triglyceridemia - TG - and total cholesterolemia - TC -). Abdomen was cut and opened along the midline and the small intestine (from pylorus to the ileocecal junction) was immediately dissected, removed, flushed with PBS (phosphate buffered saline) at 4ºC and subsequently trimmed of fat and mesentery. Weight (SIW) and length (SIL) of the small intestine as well as SIW/BW x100 were then calculated.
Plasma Analysis
Fasting glycemia (18-h fast) and 120 min glycemia after an overload of 10% glucose (200 mg/100 g body weight) via stomach tube were determined by the glucose-oxidase enzymatic method using a commercial kit (Wiener Laboratories, Argentina).
Triglyceridemia and Total Cholesterolemia (both 18-h fast) were registered through an enzymatic-colorimetric method using commercial kits (Wiener Laboratories, Argentina).
Every dosage was carried out at the same hour in the morning for avoiding possible variations due to circadian rhythms.
Histomorphometric Study
Segments of small intestine (25 cm from pylorus) were removed. These portions were cut along the mesentery border, pinned in balsa wood, fixed in Carnoy's fluid, embedded in paraffin, semi serially cut at 6 µm mounted 1 out 40 section and stained with Peryodic Acid Schiff + Hematoxylin (PAS+H). A calibrated eye objective micrometer was employed. Villi heights were measured in those sections showing the entire villus from base to tip and villi width, at the middle of each villus. Total wall thickness, mucosa thickness (distance from villus tip to muscularis mucosae), crypt depth (distance from villous base to muscularis mucosae), goblet cells/villus and enterocytes/villus were complementarily measured. A minimum of ten measurements / rat was achieved.
Lectinhistochemical Analysis
Considering the interactions among lectins, histomorphometry and/or biochemical variables, specimens were successively fixed in Bouin's fluid for 45 min. and 10% formalin in 0.01 M phosphate-buffered saline (PBS-pH 7.2) for 3 hours. Paraffin embedded tissues were cut at 6 µm, stuck on slides with Vectabond, deparaffinised with xylol and hydrated with acetone-alcohol. These slices were incubated in 3% hydrogen peroxide in absolute methanol during 20-30 min for inactivating endogenous peroxidase. Specimens were subsequently rinsed several times in 0.01 M phosphate-buffered saline (PBS-pH 7.2), dried, treated with 0.1% bovine serum albumin in PBS for 15 min and incubated overnight at 4º C with the following lectins: Canavalis ensiformis (Con-A) ( -D-mannose and -D-glucose residues), Dolichos biflorus (DBA) (N-Acetyl Galactosamine -3-N-Acetyl Galactosamine and N-Acetyl Galactosamine -3-Galactose), Arachis hypogea (PNA) (Galactose ß3-N-Acetyl Galactosamine), Ulex europaeus-I (UEA-I) (Fucose 2- Galactose-ß), Triticum vulgaris (WGA) (N-Acetylglucosamine/sialic acid group), Ricinus communis (RCA) (N-Acetylgalactosamine/galactose group), and Soy Bean (Glicine Max) Agglutinin (SBA) (D-N-Acetyl Galactosamine and ß-3-N-Acetyl Galactosamine). Lectins were employed as horseradish-peroxidase (HRP)-labelled form.
The day after, slices were rinsed with PBS, covered with the Avidin-Biotin Complex (ABC) and incubated in a substrate medium consisting of diaminobenzidine (DAB)-hydrogen-peroxide substrate medium. Reagents and lectins were purchased from Vector Labs. Finally, slices were washed with tap water, counterstained with hematoxylin, dehydrated, mounted and observed in a Zeiss investigation microscope with a color digital video camera (Sony Exwavehad model).
Digital photos in real color were selected and transformed in gray scale images for determining optical densities (OD) through an Image-proPlus Program for Windows 1.1 Version (Media Cibernetics).
For establishing the scale detailed below, structures were measured at 400X (eight counts/structure/animal). The program automatically provided the mean ± standard deviation of lectin fixation for each lectin. Lastly, a mean related with lectin fixation resulting from the total counts/ structures/ rats was determined. Zero was established from a non lectin-reactive zone whilst its maximal value, near to 250, emerged from the higher lectin- reactive zone.
Taking into account the aforesaid means, the lectin OD was graduated in accordance with the following semi-quantitative scale: OD > 200 = negative -0-, OD between 200 and 150 = weakly to moderately positive -1 to 2- and OD <150 = strongly positive -3-.
Statistical Analysis
Data were analyzed applying conventional statistical techniques as the GraphPad Prism Program, version 4.0, April 2003.
Bioethical Evaluation
Our School of Medicine Ethical Committee previously examined and approved this project.
RESULTS:
At 11 months of age, mean body weight in R animals was significantly lower than AL ones (R: 318±42 g vs. AL: 427±31 g, p<0.001) exceeding that the total food intake was equivalent during the studied period (R: 225±19 g vs. AL: 230±36 g, p>0.05). In contrast, when the total food intake was compared with body weight (relative food intake), R values were higher (R: 0.70±0.11 vs. AL: 0.53±0.12, p<0.05).
Biochemical and morphometric variables in R and AL male eSMT rats at 12 months of age are registered in Table 1.
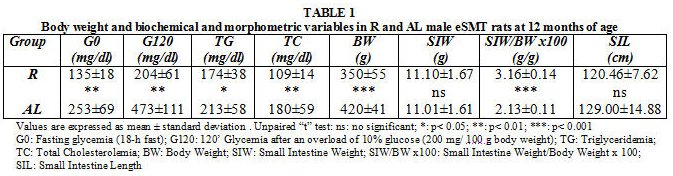
Glycemias, triglyceridemia, total cholesterolemia and body weight resulted significantly lower in the restricted group. Following the American Diabetes Association (ADA) criteria5, both groups were classified as diabetic (G0 > 126 mg/dl and G120 > 200 mg/dl). Nevertheless, AL values were notoriously higher than those of R ones.
No significant differences were detected in SIW and SIL. However, R values appeared significantly higher in SIW/BW x 100.
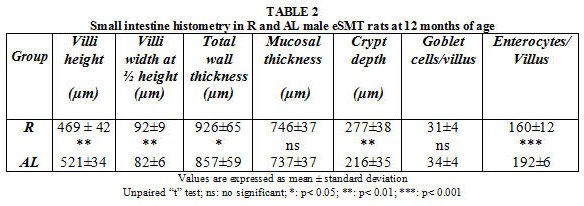
As summarized in Table 2, villi width at ½ height, total wall thickness and crypt depth were significantly higher in R animals whilst longer villi heights and more numerous enterocytes/villus were put into evidence in AL rats. Conversely, mucosal thickness and goblet cells/villus showed no significant values between both feeding plans.
Lectin histochemical results
No differential reactivity to lectins was found in villi and crypt enterocytes and goblet cells of AL rats when compared with R animals (Figures 1 and 2). However, differences appeared among lectins. Hence, a qualitative reactivity (++) with a semi-quantitative one near to 150 (2) were registered in villi enterocytes and goblet cells for every lectin (Figures 1 y 2). The only exception (+++ /<150 = 3) was evidenced in goblet cells for UEA-I. In the crypts, lectin reactivity varied from - to + (higher and near to 200 = 0/1) for every lectin except in goblet cells for RCA (++/near to 150=2) and in enterocytes for UEA-I (+++/lower than 150 = 3).
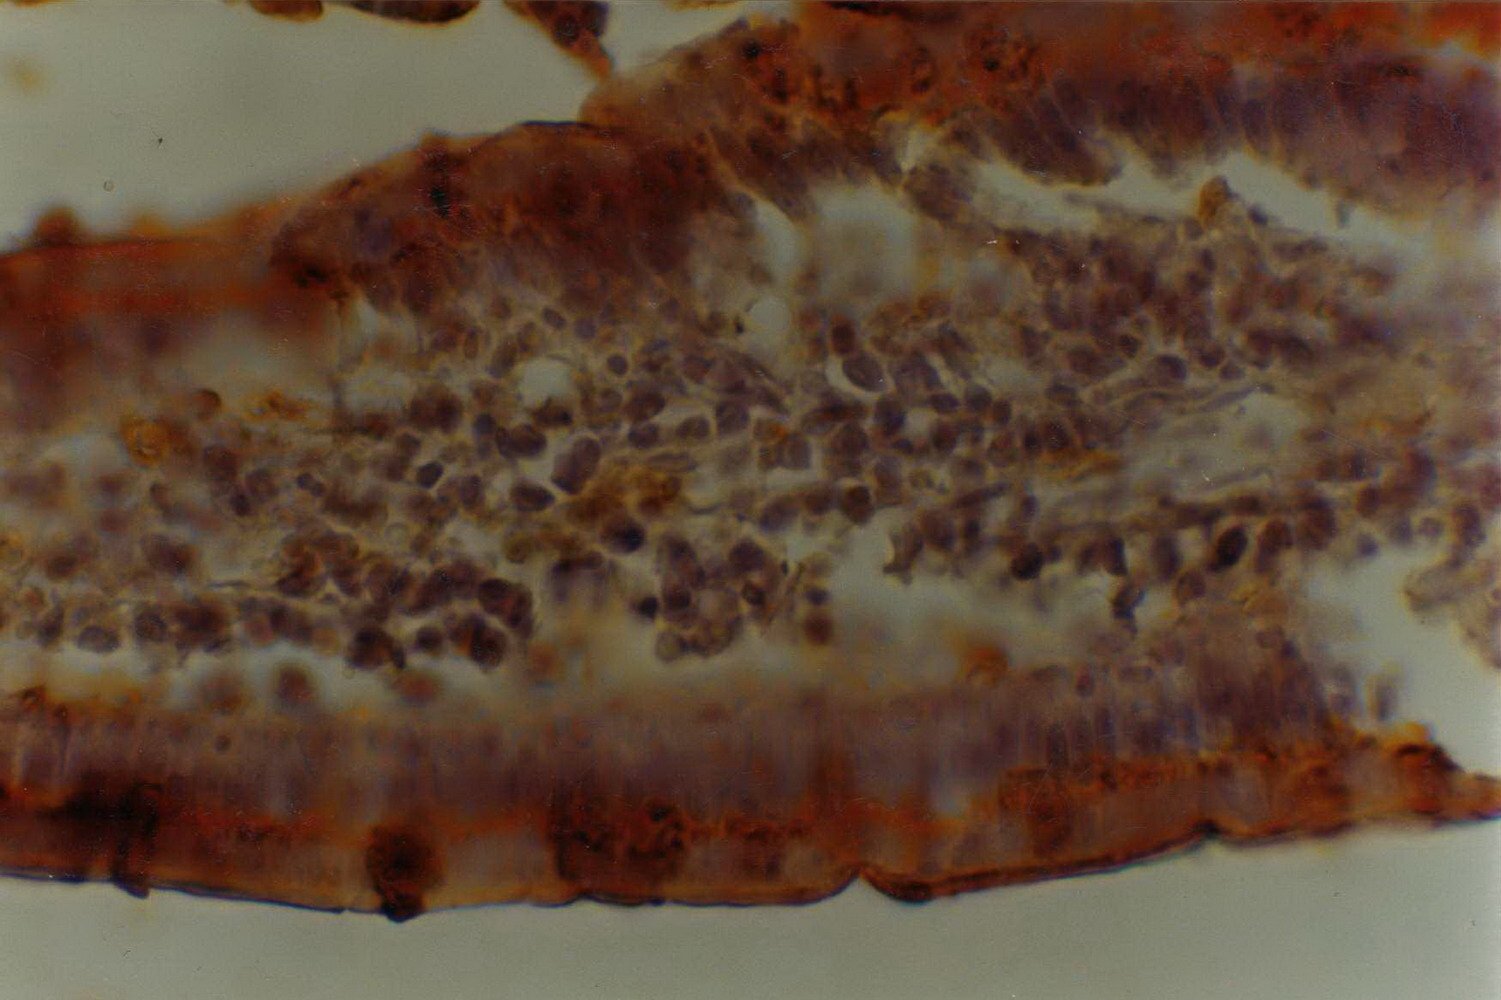
Figure 1: Histochemical reaction to Arachis hypogea (PNA) lectin in the small intestine of 12-month-old male eSMT rats exposed to ad libitum feeding schedule. Enterocytes and goblet cells are qualitatively (++) and semi-quantitatively (Optical Density = 2). The same occurs with the thin sheath of mucus located on the brush border of the enterocytes. The image is seen at a magnification of 400 X.
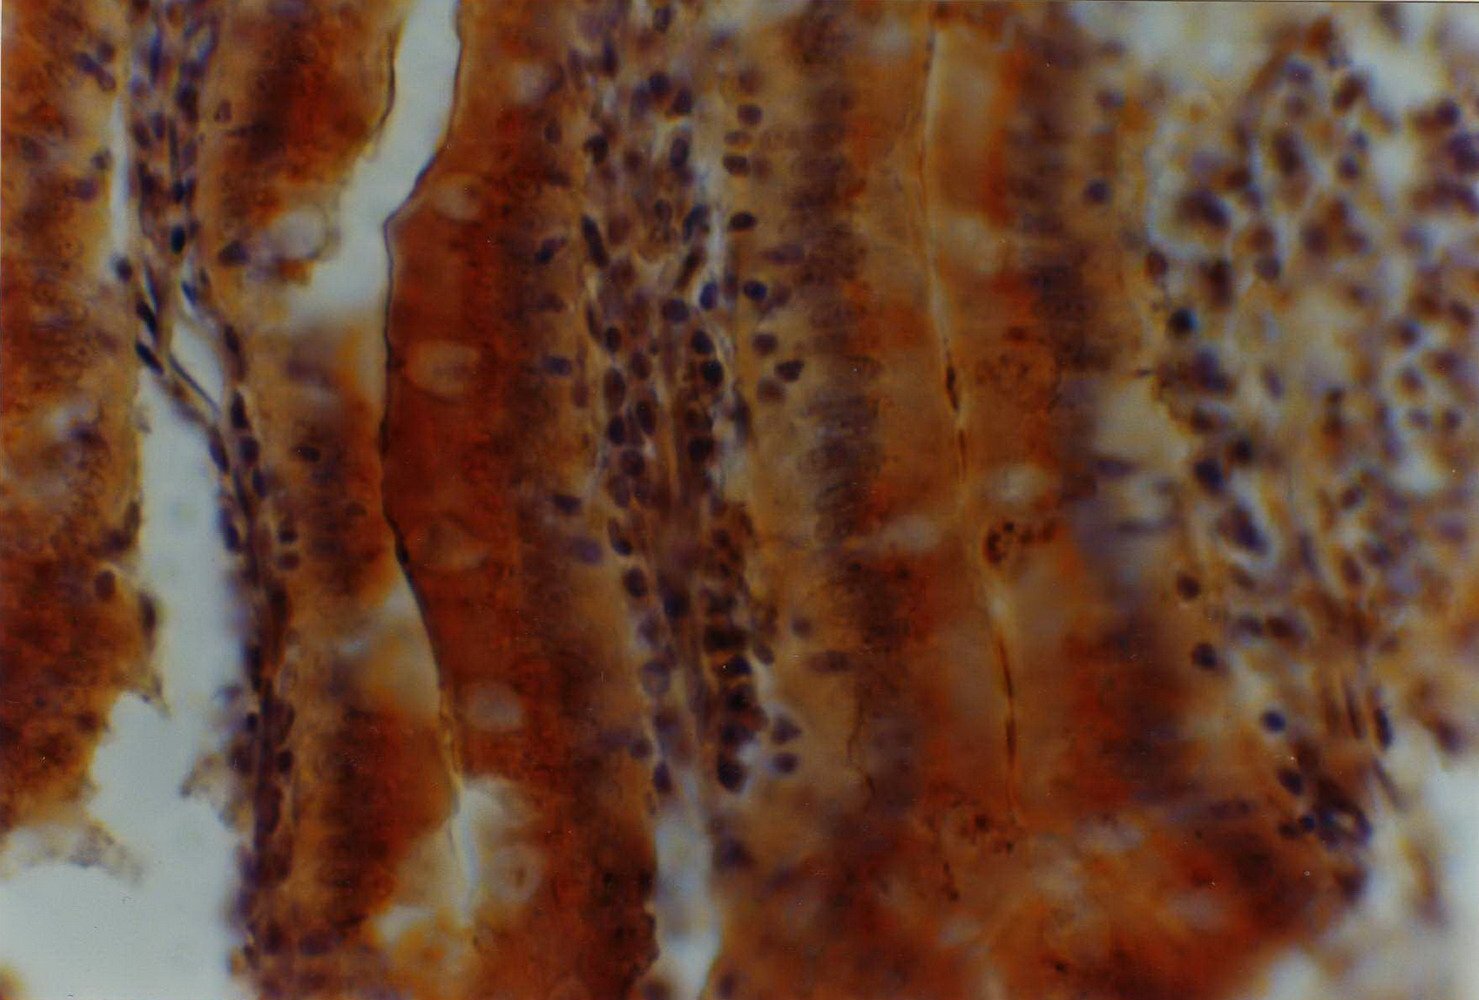
Figure 2: Histochemical reaction to Arachis hypogea (PNA) lectin in the small intestine of 12-month-old male eSMT rats exposed to restricted feeding schedule. Enterocytes and the adjacent mucus sheath are qualitatively (++) and semi-quantitatively (Optical Density = 2). The goblet cells undergo a particular functional stage after secreting the mucus which constitutes the aforesaid sheath [false negativity to PNA lectin in goblet cells with qualitative (++) and semi-quantitative (OD = 2) lectin reaction in mucus sheath]. The image is seen at a magnification of 400 X.
DISCUSSION
Considering our results, alimentary restriction ameliorated the diabetic syndrome as revealed by the decreased BW, G0, G120, TG and TC, exceeding that G0 and G120 kept showing diabetic values in restricted eSMT rats according to the ADA criteria5. These data appeared in congruence with a better performance of the diabetic genotype in "poor" environments21,22. and agreed with the more benign course of the metabolic syndrome already demonstrated in restricted eSS and OLEFT rats18,23.
On the other hand, the higher relative food intake in R animals pointed out a compensatory consume after the fasting lapse, as opportunely suggested19. This could be particularly involved in the higher relative SIW (joined to a lower BW and a similar SIL-SIW) and the greater total wall thickness registered in R rats. In this regard, Kujalova and Fabry (1960) found that the small intestine became hypertrophic when food was fed intermittently24 whilst Jervis and Levin (1966) reported lower BW and higher SIW and SIL in the small intestine of 1-year-old white rats with severe chronic-alloxan diabetes fed ad libitum25.
R animals also showed shorter villi heights, lesser enterocytes/villus, higher villi width at ½ heights and deeper crypts, In this sense, changes in crypt depth have been associated with alterations in the maturity of cells26.
The presence of distinct quantities of nutrients in the lumen, the endocrine imbalance of chronic diabetes and/or the intestinal hormones (incretins and others)27 could be interacting to produce the aforesaid results.
In turn, the histometric differences between eSMT and STZ-induced diabetic rats7,8,26 may be supported in the frequently higher fasting glycemia (400 mg/dl or more) of the last ones, capable of altering the relations between the glucolipid profile and the small intestine histological patterns when long-term effects of type 2 diabetes are taken into account.
Both feeding schedules did not seem to affect lectin binding. Thus, differences detected in villi and crypt enterocytes and goblet cells could be attributed to distinct glucidic constitution of those structures and could be reflecting variations in intestinal function and differentiation28.
Most of these results in eSMT rats appeared coincident with those formerly reported by other workers in non diabetic rats suggesting that, at this age, glucidic residues were similar to those studied in our diabetic line29,30. Conversely, our results were not coincident with obtained in mice where distinct feeding schedules produced different lectin bindings31. In this regard, species-dependent reasons may be put forward.
Whatever the achieved results be, the physiological levels of the epithelial mucins appear necessary for the normal intestinal uptake and the absorption of nutrients.
While the two feeding schedules here employed are in a straight line related with biochemical variables and body weight, its relation with morphometric and histometric findings in the small intestine could be neither confirm nor denied. Exceeding the reasonable interactions among lectins, histomorphometry and/or biochemical variables, other ways of relations remain to be established.
To sum up, eSMT rats, a suitable animal model for studying diabetes and/or its complications, revealed at 12 months of age after undergoing a restricted feeding schedule (R animals):
1. A predictable improvement in body weight and defined biochemical variables related with the diabetic syndrome (G0, G120, TG and TC). Although no category modification could be established according to ADA criteria since GO and G120 did not reach euglycemic values, both showed a eye-catching nearness to the border to impaired fasting glucose (125 mg/dl) and impaired glucose tolerance (199 mg/dl)
2. Changes in certain histometric patterns with the exception of those morphometric related with small intestine length and weight. In this regard, a non-published report32 evidenced that the histometric patterns studied in the small intestine of Wistar rats (a common euglycemic control) did not significantly differ at this age with those of AL- eSMT ones. This could suggest that at this age no adaptive diabetic impacts are still detected in the small intestine of eSMT rats fed ad libitum
3. No modifications in lectinhistochemical patterns between AL and R eSMT rats
REFERENCES
- 1. Flegal KM. The obesity epidemic in children and adults: current evidence and research issues. Med Sci Sports Exerc. 1999; 31: S509-S514.
2. Bertram CE, Hanson MA. Animal models and programming of the metabolic syndrome. Br Med Bull. 2001; 60:103-21.
3. Buschard K. The Use of Diabetic Animal Models. Meet A Research Group. Diabetes Research Group, Bartholin Instituttets, Copenhagen, Denmark. Scand J Lab Sci. 2001; 28: 58-58.
4. Kaplan JR, Wagner JD. Type 2 Diabetes - An Introduction to the Development and Use of Animal Models. Institute for Laboratory Animal Research (ILAR) Journal. 2006; 47(3):181-185.
5. American Diabetes Association. Diagnosis and Classification of Diabetes Mellitus. Diabetes Care. 2008; 31: S55-S60.
6. Srinivasan K, Ramarao P. Animal models in type 2 diabetes research: An overview. Indian J Med Res. 2007; 125: 451-472.
7. Okamoto J, Kanemoto N, Ohbuchi Y, Okano M, Fukui H et al. Characterization of STZ-induced type 2 diabetes in Zucker fatty rats. Exp. Anim. 2008; 57: 335-345.
8. Tormo MA, Martínez IM, Romero de Tejada A, Gil-Exojo I, Campillo JE. Morphological and enzymatic changes of the small intestine in an n0-STZ diabetes rat model. Exp. Clin. Endocrinol. Diabetes. 2002; 110:119-123.
9. Tarrés MC, Montenegro SM, Martínez SM, Picena JC, Toniolo M et al. The eSMT rat: a murine model of type 2 human diabetes. Animal research and welfare. A partnership proceedings of the international joint meeting XII ICLAS General Assembly & Conference 7th FELASA Symposium. J.A. Tur & JM. Orellana (Managing editors). Laboratory Animals Ltd, pp. 93-94, London, 2000.
10. Picena JC, Montenegro SM, Tarrés MC, Martínez SM. Modificaciones dinámicas en los islotes de Langerhans de dos Líneas de ratas espontáneamente diabéticas. Medicina (Buenos Aires). 2007; 67: 331-340.
11. Dyer RG. Traditional treatment of obesity: does it work? Baillieres Clin Endocrinol Metab. 1994; 8:661-688.
12. Jacobs LR. Effects of dietary fiber on mucosal growth and cell proliferation in the small intestine of the rat: a comparison of oat bran, pectin, and guar with total fiber deprivation. Am J Clin Nutr. 1983; 37:954-960.
13. Duffy PH, Seng JE, Lewis SM, Mayhugh AA, Hattan DG et al. The effects of different levels of dietary restriction on aging and survival in the Sprague-Dawley rat: implications for chronic studies Aging Clin. Exp. Res. 2001; 13:263-272.
14. Heller DT, Holt PR, Richardson A. Food restriction retards age-related histological changes in rat small intestine. Gastroenterology. 1990; 98:387-391.
15. Holt PR, Moss SF, Heydari AR, Richardson A. Diet restriction increases apoptosis in the gut of aging rats. Journals of Gerontology Series A: Biological Sciences and Medical Sciences. 1998; 53:168-172.
16. Cefalu WT, Wang ZQ, Bell-Farrow AD, Terry JG, Sonntag W, Waite M, Parks J: Chronic caloric restriction alters muscle membrane fatty acid content. Experimental Gerontology. 2000; 35:331-341.
17. Lipman RD, Smith DE, Blumberg JB, Bronson RT. Effects of caloric restriction or augmentation in adult rats: longevity and lesion biomarkers of aging. Aging. 1998; 10:463-470.
18. Martínez SM, Tarrés MC, Montenegro SM, Relevant G, D'Ottavio AE et al. Intermittent dietary restriction in eSS diabetic rats. Effects on metabolic control and skin morphology. Acta Diabetológica Latina. 1990; 27:4:329-336.
19. Montenegro SM, Tarrés MC, Picena JC, Martínez SM. Conducta alimentaria y perfil glucémico en dos líneas de ratas con diabetes genética: eSS y eSMT. Biomédica.2005; 25:441-450.
20. Frontini AV, Hisano N, D'Ottavio AE. La densidad óptica aplicada al estudio lectinhistoquímico de radicales glucídicos néfricos en ratas diabéticas tipo 2. Rev Electron Biomed / Electron J Biomed 2008; 1: 36-42.
21. Ohneda M, Inman LR, Unger RH. Caloric restriction in obese pre- diabetic rats prevents beta cell depletion, loss of beta- cell Glut 2 and glucose incompetence. Diabetologia 1995; 38: 173-179.
22. Vuguin P, Ma X, Yang X, Surana M, Liu B, Barzilai N. Food deprivation limits insulin secretory capacity in postpubertal rats. Pediatr Res. 2001; 49: 468-473.
23. Luan Y, Hirashima T, Man ZW, Wang MW, Kawano K et al. Pathogenesis of obesity by food restriction in OLETF rats-increased intestinal monoacylglycerol acyltransferase activities may be a crucial factor. Diabetes Res Clin Pract. 2002; 57:75-82.
24. Lesly JE, Levin RJ. Anatomic adaptation of the alimentary tract of the rat to the hyperphagia of crhronic-alloxan diabetes, Nature. 1966; 5034:391-393.
25. Fabry P, Kujalova V. Enhanced growth of the small intestine in rats as a result of adaptation to intermittent starvation. Acta Anat (Basel). 1960; 43:264-271.
26. Keelan M, Walker K, Thomson ABR. Intestinal brush border membrane marker enzymes, lipid composition and villus morphology: effect of fasting and diabetes mellitus in rats. Comp. Biocem.Physiol. 1985; 82A: 83-89.
27. Simonska-Cichocka E, Gumprecht J, Zelobowska K, Witkowska A, Grzeszczak W. Incretins - new paradigms for the treatment of type 2 diabetes mellitus. Diabetologia Do?wiadczalna i Kliniczna. 2007; 7: 120-126.
28. Gelberg H, Whiteley H, Ballard G, Scott J, Kuhlenschmidt M. Temporal lectin histochemical characterization of porcine intestine Am. J. Vet Res.1992; 53:1873-1880
29. Baintner K, Jakab G, Gyôri Z, Kiss P. Binding of FITC-labelled lectins to the gastrointestinal epithelium of the rat. Pathol Oncol Res. 2000; 6:179-183.
30. Schumacher U, Madry H, Adam E, Peumans WJ, van Damme EJ et al. Analysis of lectin binding sites in the gut of hooded Lister rats with special emphasis on recently detected lectins. Acta Histochem. 1993; 94:163-166.
31. Gupta R, Jaswal VM, Mahmood A. Intestinal epithelial cell surface glycosylation in mice. 1. Effect of low-protein diet. Ann. Nutr. Metabol.1992; 36:71-78
32. Liberali A. Histometric patterns in the small intestine of 1 year-old- Wistar rats fed ad libitum. Final Report. Secretariat of Science and Technology. Faculty of Medical Sciences, Rosario National University, 2000.
Correspondence:
Alberto Enrique D'Ottavio.
Medical School, Faculty of Medical Sciences.
Rosario National University.
Santa Fe 3100. 2000 Rosario. Argentina
aedottavio @ hotmail.com
Acknowledgement: This paper was financially supported by the National University of Rosario (Argentina) and Wiener Lab, Rosario (Argentina).