Indice del volumen Volume index
Comité Editorial Editorial Board
Comité Científico Scientific Committee
- Y = 0.4734 X
- r2 = 0.9927
- r = 0.9885
METHOD DEVELOPMENT AND VALIDATION OF FENOFIBRATE BY HPLC USING HUMAN PLASMA
M.T. Zzaman1, S.A. Khan2, A. Arora1, O. Ahmad 2
1KIET School of Pharmacy, Ghaziabad.
2Department of Pharmaceutical Chemistry, Faculty of Pharmacy,
Jamia Hamdard, Hamdard Nagar, New Delhi.
India
zzaman007 @ yahoo.co.in
Rev Electron Biomed / Electron J Biomed 2009;3:41-54.
Comment of the reviewer Prof. Pilar Muñiz PhD. Titular del Área de Bioquímica y Biología Molecular de la Facultad de Ciencias de la Universidad de Burgos. Burgos, España.
Comment of the reviewer Silvia Albillos García PhD. Inbiotec Instituto de Biotecnología. León, España
SUMMARY:
The objectives of the study were to develop a rapid, simple, and economical HPLC method for the estimation of Fenofibrate in plasma and to validate the developed bioanalytical method.
This research paper describes an specific procedure for determination of Fenofibrate in human plasma. The method employs reverse phase liquid chromatography with UV detection. The mobile phase used was simple and column friendly and was sufficiently sensitive to quantify Fenofibrate in amounts as low as 0.095 µg/ml. This limit of quantitation (LOQ) was determined as the lowest concentration with a coefficient of variation lower than 20% and the total accuracy of the method ranged from 101.99 to 107.41%. The LOQ of this method is better than those of other reported methods. The calibration curve plotted concentration versus area and was linear from 0.095 µg/ml to 19.924 µg/ml, having r2 greater than 0.98 during the course of validation. The above method is valid for the analysis of drug in human plasma. The method with slight modification could be used for the drug analysis in various dosage forms.
KEY WORDS: Fenofibrate. LOQ. Bioanalytical method.
RESUMEN:
Los objetivos de este estudio fueron desarrollar un método rápido, sencillo y económico de HPLC para la estimación de Fenofibrato en el plasma y para validar el método bioanalítico desarrollado.
Este trabajo de investigación describe un procedimiento específico para la determinación de Fenofibrato en el plasma humano. El método emplea fase inversa de la cromatografía líquida, con detección UV. La fase del móvil utilizada fue sencilla y la columna apropiada y fue suficientemente sensible cuantificar Fenofibrato en cantidades tan bajas como 0,095 µg/ml. Este límite de cuantificación (LOQ) fue determinado como la concentración más baja con un coeficiente de variación menor del 20% y la certeza total del método en intervalos entre 101,99 a 107,41%. El LOQ de este método es mejor que el otros métodos conocidos. La curva de la calibración tramó concentración versus área y fue lineal desde 0,095 µg/ml hasta 19,924 µg/ml, teniendo r2 mayor de 0,98 durante el proceso de la validación. El método mencionado es válido para el análisis de droga en el plasma humano. Este método con leves modificaciones podría ser utilizado para análisis de droga en varias formas de dosificación.
PALABRAS CLAVE: Fenofibrato. LOQ. Método bioanalítico.
INTRODUCTION
Analytical methods for the quantitative determination of drugs and their metabolites in biological samples play a significant role in the evaluation and interpretation of bioavailability, bioequivalence and pharmacokinetic data. Chromatographic methods are commonly used in regulatory laboratories for the qualitative and quantitative analysis of drug substances, drug products, raw materials and biological samples through all phases of drug development and from research to quality control1-8.
Throughout the drug development process, method validation is carried out to ensure that an analytical method is accurate, specific, reproducible and rugged over the specific range in which the analyte will be analysed.
As per USP (United States Pharmacopeia), validation of an analytical method is the process by which it is established by means of experimental studies, that the performance of the method meets the requirements for the intended analytical application.
Performance is expressed in terms of analytical parameters which include for assay validation the determination of precision, accuracy, limit of detection, limit of quantitation, selectivity, range, linearity and ruggedness.
Above all, the stability of a drug in a biological matrix is also important such as bench top stability, freeze-thaw stability, stability in the autosampler and long term stability.
Fenofibrate is a drug that helps reduce several types of fat in the blood9-10. Fenofibrate is especially good at lowering triglycerides and very low density lipoproteins, (VLDL). High levels of VLDL causes pancreatitis/severe stomach pain and even death.
MATERIALS AND METHODS:
Fenofibrate was obtained from Ranbaxy Research Labs New Delhi, India. Biological Matrix (Blank Human Plasma) was obtained from Fortis Clinical research Ltd. India. Potassiumm dihydrogen orthophosphate was procured from Qualigens fine chemicals Mumbai, India. All other reagents were of analytical grade and were used as received.
EXPERIMENTAL:
Sample Preparation
Samples of 750 µl of plasma were taken. To this 50 µl (75 µg/ml) of Diazepam as internal standard (IS) was added. The samples were vortex mixed for about 1 min and 100 µl of 0.1 N hydrochloric acid and 4.0 ml ethyl acetate were also added. The contents were transferred to a shaker for 10 min at 100 rpm and centrifuged for 2 min at 5°C. Then 3.0 ml of the upper organic layer were transferred and evaporated under N2 gas at100psi and 50° C. The sample was finally reconstituted with 400 µl of mobile phase, transferred into the chromatography vials and 100 µl injected.
Chromatographic Conditions
The following conditions were used for the developed method and chromatograms were obtained for the drug and IS aqueous mixtures, extracted blank plasma sample, extracted blank plasma with IS sample and extracted blank plasma with drug.
-
Column: Lithosphere 60 RP-Select B 250x4mm ; 5 µm
Column Temp.: 35°C
Flow Rate: 0.7 to 1.5 ml/min
Detector: UV at 287 nm
Mobile phase: Phosphate buffer (pH 6.0) and Acetonitrile (70:30)
Injection volume: 100 µl
Internal standard: Diazepam
Retention Time
-
Fenofibrate: 5.5. to 6.5 min
Diazepam: 4.5 to 5.5 min
METHOD DEVELOPMENT
1. Preparation of standard stock solutions: Preparation of standard stock solutions was done as per (Table-I)
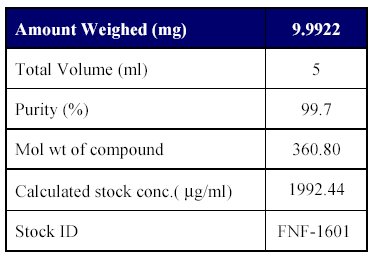
Table I : Preparation of analyte stock dilution
2. Preparation of internal standard (IS) stock solution: The stock solution was prepared in HPLC grade methanol by weighing accurately 5 mg of Diazepam (IS) and transferred to a 5 ml volumetric flask. It was dissolved with methanol and the volume was made up to 5 ml so that a solution of 1 mg/ml concentration was obtained. This solution was stored at -100C in a refrigerator.
3. Preparation of IS stock dilution: The IS stock dilution was prepared using mobile phase as the diluents, as given in Table II.
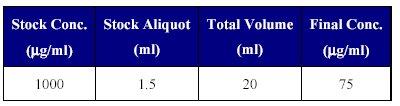
Table II: Preparation of IS dilution.
This IS dilution of 75 µg/ml was used in sample processing for the addition of IS.
4. Preparation of analyte working standard stock solution: As the drug is insoluble in water it was prepared in methanol. The solution was made by weighing accurately 5 mg of Fenofibrate standard and transferred to a 10 ml volumetric flask. It was dissolved in 5ml methanol to a final concentration of 1992.44 µg/ml This represents the final concentration corrected for its purity (99.7%), and actual amount weights. Suitable dilutions from this stock were prepared with mobile phase for spiking in plasma solution and stored at -100C throughout the experiment as shown in Table III.
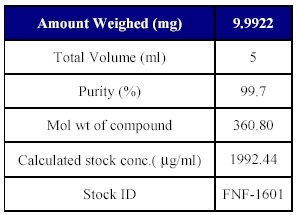
Table III : Preparation of analyte stock dilution
5. Preparation of dilutions of Fenofibrate stock solution for CC standards: Just prior to spiking, stock dilutions of Fenofibrate were prepared using mobile phase as diluent (as shown in Table IV).
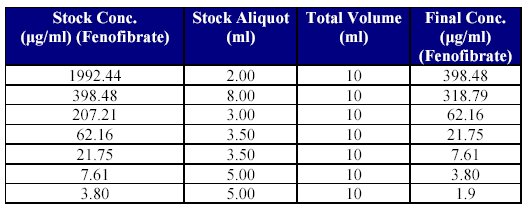
Table IV: Preparation of drug stock dilutions for CC spiking
6. Spiking of plasma for calibration curve (CC) standards: Spiking of blank human plasma was done by transferring 250 l of each of the dilutions, into 5 ml volumetric flaks and volume was made up with blank plasma to achieve the concentration given in Table V.
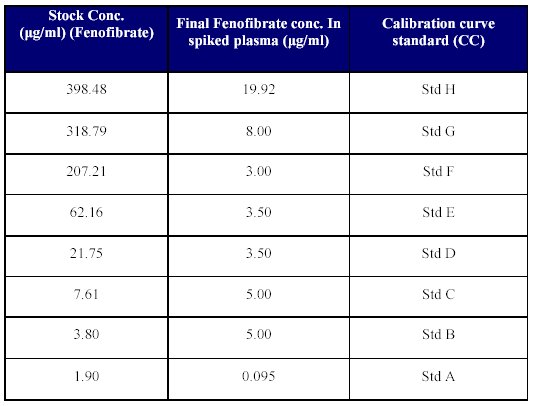
Table V: Spiking of plasma.
Aliquots of 1 ml each of the calibration spiked plasma standards were pipetted out and poured into polypropylene tubes. These tubes were then stored at -25 to -30°C until analyzed.
7. Preparation of dilution of Fenofibrate stock solution for Quality Control (QC) Samples: Just prior to spiking for the QC samples, suitable stock dilutions of the drug using mobile phase as the diluent, were prepared as given in Table VI.
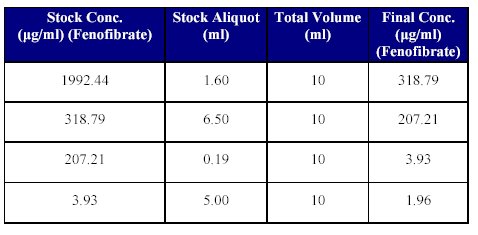
Table VI: Fenofibrate stock dilutions for QC spiking.
8. Spiking of plasma for QC samples: Plasma was spiked for the QC samples by transferring 250 µl of each of the dilutions described in Table IV into 5 ml volumetric flaks and the volume was made up with plasma to achieve the QC samples as given in the Table VII. Aliquot of 1 ml were pipetted of each of the spiked plasma standards into polypropylene tubes and stored at -30°C until analyzed.
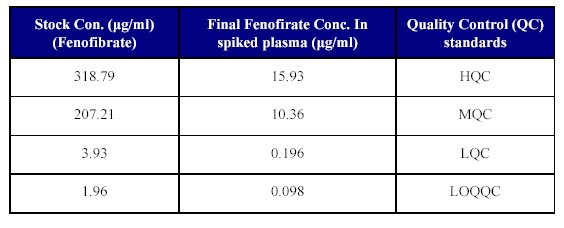
Table VII: Spiking of plasma for QC samples
VALIDATION:
1. System Suitability test:
A system suitability test of the HPLC system to be used for validation was done by running six injections of drug dilution. Coefficient of variation in percentage (%CV) of areas and retention times were calculated. %CV of area was less than 2% and that of the retention times was less than 5%, which is within the acceptable range.
A system suitability test of one more system to be used for ruggedness was done in the same manner as above, and the system passed the system suitability test
2. Precision
The precision of the method based on within-day repeatability was determined by replicate analysis of six sets each of high, middle and low quality control samples. The reproducibility (day-to-day variation) of the method was validated using similar six sets of high, middle and low quality control samples on different days. Coefficients of variation (CV's) were calculated from the ratios of standard deviation (SD) to the mean and expressed as percentage.
3. Accuracy
Accuracy of the method was determined by replicate analysis of six sets of sample at high, middle and low quality control concentrations and comparing the difference between the spiked value (nominal) and that actually found. Accuracy was expressed as percentage of the nominal concentration.
4. Recovery
The analytical recovery of sample preparation procedure of Fenofibrate and the internal standard (Diazepam) was estimated by comparing the peak areas obtained from plasma samples (extracted) at three concentration levels (LQC, MQC, HQS), with equivalent amounts of and IS Diazepam in aqueous solution.
5. Selectivity
The selectivity of the method was verified by checking the interference of endogenous compounds in human plasma at the retention time of the drug and IS by evaluating six lots of plasma.
6. Stability
Stability was evaluated by determining the following five parameters:
- a. Stock solutions stability
The drug stock solution was evaluated by injecting six replicate samples of old stock solutions and comparing the response with freshly prepared stock solution.
The stock solution stability of the internal standard stock was evaluated by the same process.
b. Bench top stability
The bench top was stability was determined at lower and higher quality control samples by evaluating 6 replicate samples at each level. The samples were processed after keeping them at bench top (room temperature) for about 2 hours and then analyzed against freshly spiked calibration curve standards.
c. Freeze-thaw stability
The freeze-thaw stability in matrix was studied by assaying six replicates of QC samples at low and high concentrations previously frozen and thawed over three cycles against freshly spiked calibration standards. The samples were first frozen at -270C for at least 40 hours followed by unassisted thawing at room temperature. The samples were again frozen for at least 12 hours under the same conditions. This freeze-thaw cycle was repeated two more times and the samples were then processed after the third cycle and analyzed.
d. Auto sampler stability
Stability in the auto sampler was assessed by extracting six replicates of QC samples at low and high concentration and putting the processed samples in the atmosphere. The samples were injected after 120 hours along with freshly spiked calibration standards.
e. Long-term stability
The long-term evaluation was performed following a storage period of about 60 days. Six replicates of the stored low and high concentration QC samples were removed from the freezer/cold room and allowed to thaw. The samples were processed and analyzed against freshly spiked calibration standards.
RESULTS AND DISCUSSION
Method Development
To develop a precise, accurate and reproducible HPLC method for the estimation of Fenofibrate in plasma, various mobile phases, stationary phases and various sample preparation methods were tried and the proposed chromatographic conditions were found appropriate for the quantitative determination.
Chromatographic conditions: The chromatographic column used was a C18 Lichrospher 60Rp-Select B (250 x 4.0 mm with a practicle size of 5µm). The mobile phase comprised of Phosphate buffer: Acetonitrile (70:30). The buffer solution consisted of potassium dihydrogen orthophosphate (40mM). The pH was adjusted to 6.00 ±0.5 with the addition of potassium hydroxide. Adequate retention times for both the drug as well as the IS were obtained without plasma interferences. The mobile phase was pumped at a flow rate of 0.7 to 1.5 ml/min. The column oven temperature was set to 350C ± 2 and the eluent was detected at 287nm. The injection volume was 100µl.
Validation Study
After optimization of the analytical conditions, the evaluation of parameters such as selectivity, accuracy, precision, linearity, recovery (drug and internal standard), stability (freeze-thaw, bench top, autosampler, long term, stock solution stability), ruggedness and dilution integrity were performed for the validation of the method.
Selectivity
Six lots of blank plasma were evaluated and an interfering peak was observed at the retention time of the drug, but the area of the interfering peak was small and insignificant. There were no interfering peaks at the retention time of the internal standard (Table VIII). Thus the method seems to be selective enough for the determination of Fenofibrate for pharmacokinetic purposes.
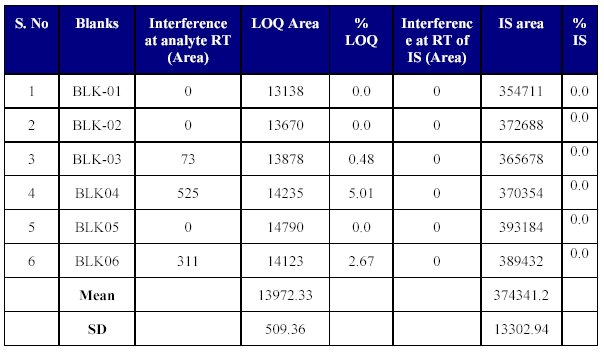
Table VIII: Blank plasma screening (Selectivity)
Precision and Accuracy
Precision and accuracy of the method was characterized by running five analytical batches; each batch contained the following samples:
-
(a) A reference standard solution (one sample, mixture with internal standard)
(b) Blank matrix (in duplicate)
(c) Blank matrix with internal standard (in duplicate)
(d) Spiked calibration standards (1set of 8 non-zero concentrations)
(e) Limit of quantitative quality control (LOQQC) (6 samples)
(f) Lower quality control (LOQ) (6 samples)
(g) Middle quality control (MQC) (6 samples)
(h) Higher quality control (HQC) (6 samples)
1. Precision: The precision of the method was measured by the present coefficient of variation (%CV) over the concentration range of high, middle and low quality control samples, respectively, of the drug during the course of validation.
Within batch/intrabatch precision: Within batch/interbatch precision of the method ranged from 1.14 to 6.90%.
Inter batch/between batch precision: The inter batch/between batch precision of the method was found to be 4.35 to 8.38%.
2. Accuracy: The accuracy of the assay is defined as the peak area ratio response of the drug and internal standard versus concentration of the quality control sample to their respective nominal values, expressed as percentage.
Within batch accuracy: Within batch accuracy of the method for the drug was found in the range of 90.30 to 110.60%.
Between batch/interbatch or total accuracy: The total accuracy of the method ranged from 101.99 to 107.41%.
The linearity of the method was determined by a weighted least square regression analysis of standard plot associated with an eight point standard curve. The calibration curve plotted concentration versus area (Table IX) and was shown to be linear from 0.095 µg/ml to 19.924 µg/ml as shown in fit calibration lines of peak are response of drug and internal standard versus concentration of calibration standards were determined by weighted least square regression analysis with a weighting factor 1/X2. The regression coefficient (r2) were consistently greater than 0.98 during the course of validation.
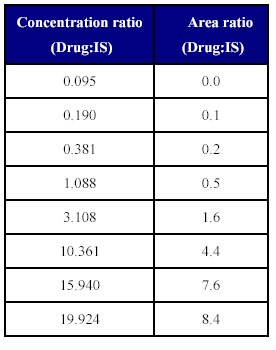
Table: IX Concentration ratio vs. area of the (Drug: IS)
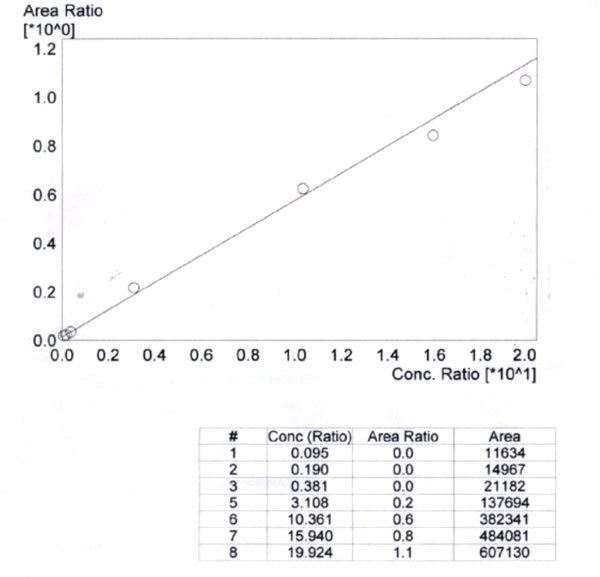
Figure 1: Concentration ratio vs area ratio
Statistical parameters for the calibration curve
Recovery
The percentage recoveries for the drug and the internal standard were determined by comparing the peak areas of the response of drug extracted from plasma quality control samples with that of the peak areas of un extracted aqueous standard samples containing the same concentration of the drug and the internal standard.
The present recoveries were calculated at each QC concentration by the following equation.
Mean peak response of extracted samples
% Recovery =
Mean peak response of non-extracted samples
The total recovery of the drug was 58.21 to 64.20% (mean recovery=60.86%) and that of the internal standard was 79.05%. (Tables X-XII)
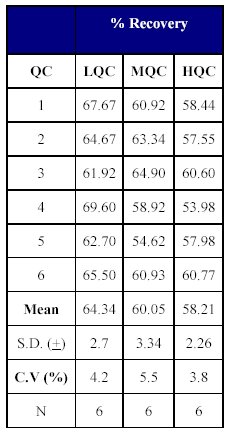 Table X: Recovery of drug from human plasma. | 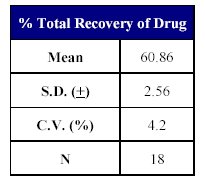 Table XI: Total Recovery of drug. |
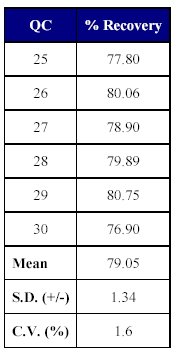 Table XII: Recovery of internal standard from human plasma |
The recovery of the method was acceptable as the mean recovery of the drug was above 60% and that of the internal standard was found to be close to 80%.
Stability
Stock solution stability The stability of drug stock solution was evaluated by injecting a dilution of 3.808 mg/ml solution of the stock. The results indicate the stability of the stock solution over a minimum of 15 days period when stored at or below 100C (Table XIII )
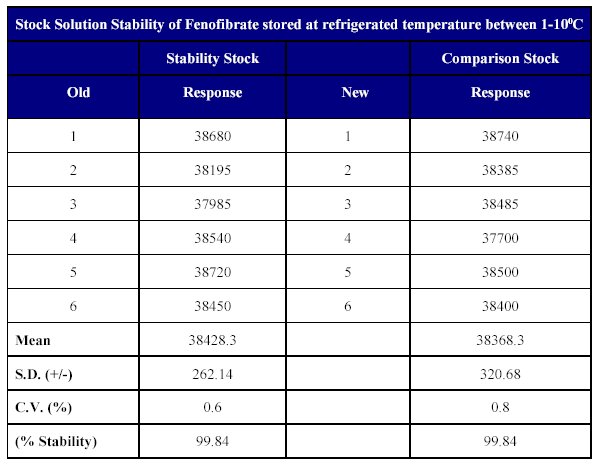
Table XIII: Stock solution stability of Fenofibrate in methanol.
The stock solution stability results indicate that the drug is stable in methanol for a sufficiently long period of time when stored at or -10°C.
Freeze-thaw Stability
The stability of the spiked plasma samples was determined after three freeze-thaw cycles. After the third cycle, replicates of each lower and higher quality control samples were analyzed. The percentage degradation was determined by back calculating their concentration against freshly spiked calibration curve samples. The concentration of the freeze-thaw samples was calculated to be 97.36 to 112.2% of the nominal concentration indicating the stability of the drug over three freeze-thaw cycles (Table XIV).
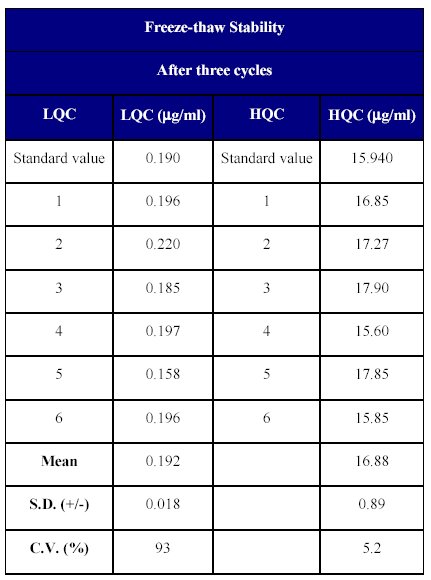
Table XIV: Freeze-thaw stability of Fenofibrate in human plasma.
The freeze thaw stability over three cycles suggested that the drug is quite stable and can withstand processing delays.
Auto sampler stability:
The stability in the auto sampler was determined at lower and higher quality control samples by analyzing 6 replicates at each level. The stability of the drug was determined back calculating the concentration of the stability samples against freshly processed calibration curve standards. The samples were stable for at least 24 hours in the auto injector. The back calculated concentration ranged from 99.12 to 112.29% of the nominal concentration (Table XV).
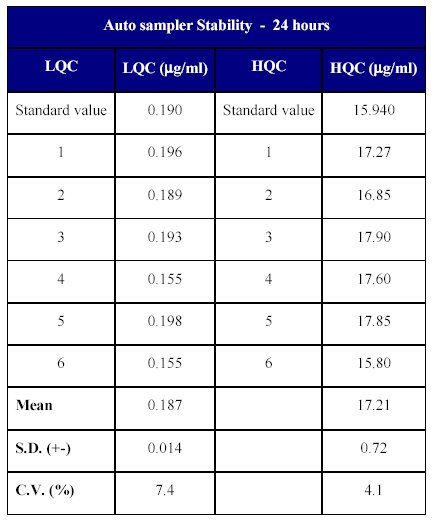
Table XV: In-injector stability of Fenofibrate in human plasma
The results of the auto sampler stability indicate that the drug can remain stable in the auto injector (<10°C) for a period of time which exceeds the time period from the injection of the first sample until the injection of the final sample in a batch.
Bench top stability:
Batch top stability was determined at lower higher quality control samples by evaluating 6 replicate samples at each level. The drug was found to be stable for at least 24 hours at bench top (at room temperature). The back calculated concentration against freshly spiked calibration standards was within a range of 102.6 to 112.29% of the nominal values (Table XVI).
Table XVI: Bench top stability of Fenofibrate in human plasma
The bench top stability indicates that the drug is stable enough for a period of time so that it can withstand the time period between the retrieval of the samples from the cold room until its final processing, which is done at room temperature.
CONCLUSIONS
The method was subjected to complete validation and all the parameters showed results within the acceptance limits. A linear response between the concentration range of (0.095 µg/ml to 19.924 µg/ml) was obtained. The limit of quantitation using 450 µl of plasma was 0.095 µg/mL. The accuracy and precision of the method was evaluated by peak area response of the drug and internal standard.
The total precision (% CV) and accuracy (% normal) for the drug ranged from 4.35 to 8.38% and 101.99 to 107.41%, respectively. The mean recovery of the drug and IS was found to be 62.9 and 78.2% respectively.
REFERENCES
-
1.- Akapo SO, Matyska MT, Pesek JJ. Retention characteristics and selected applications of cyclic siloxane-based octadecylsilyl bonded phases in reversed-phase high-performance liquid chromatography. J. Chromatography A. 1977; 773: 53-63
2.- Green JM. J. M. Green, A practical guide to analytical method validation. Anal Chem News & Features. 1 May 1996: 305A309A.
3.- Gustavson LE, Schweitzer SM, Burt DA, Achari R, Rieser MJ, Edeki T, Chira T, Yannicelli HD, Kelly MT. Evaluation of the potential for pharmacokinetic interaction between fenofibrate and ezetimibe: A phase I, open-label, multiple-dose, three-period crossover study in healthy subjects. Clin Ther. 2006;28:373-387.
4.- Kirschbaum JJ. Inter-laboratory transfer of HPLC methods: problems and solutions. J Pharm Biomed Anal. 1989;7:813-833.
5.- Carr GP, Wahlich JC. A practical approach to method validation in pharmaceutical analysis. J Pharm Biomed Anal. 1990;8:613-618.
6. Meyer VR. Influence of leaks in the liquid chromatographic instrument on analytical results. J. Chromatography A 1997;767:25-31
7. Stanley BJ, Foster CR, Guiochon G . On the reproducibility of column performance in liquid chromatography and the role of the packing density. J. Chromatography A 1997;761: 41-51
8.- Shah VP, Midha KK, Dighe S, McGilveray IJ, Skelly JP, Yacobi A, Layloff T, Viswanathan CT, Cook CE, McDowall RD, Pittman K, Spector S. Analytical methods validation: bioavailability, bioequivalence, and pharmacokinetic studies. J Pharm Sci 1992;81:309-312.
9.- Ferreira AV, Parreira GG, Green A, Botion LM. Effects of fenofibrate on lipid metabolism in adipose tissue of rats. Metabolism. 2006;55:731-735.
10.- Hersberger M, von Eckardstein A. Modulation of high-density lipoprotein cholesterol metabolism and reverse cholesterol transport. Handb Exp Pharmacol. 2005;(170):537-561.
CORRESPONDENCE:
M.T.Zzaman
138 -B DESU Colony Maharanibagh.
New Delhi -110014, India.
zzaman007 @ yahoo.co.in