Indice del volumen Volume index
Comitķ Editorial Editorial Board
Comitķ CientĒfico Scientific Committee
COMPARATIVE ANALYSIS OF HEALTH CAPITAL, FRAILTY AND AGING AMONG OLD PEOPLE WITH AND WITHOUT MEANS OF SUPPORT
Jauregui JR, MD PhD.1,2, Musso CG, MD PhD.2, Kaplan R, MD.234,
MacĒas N·±ez JF MD PhD.4
1Geriatric Section. Internal Medicine Department. Hospital Italiano of Buenos Aires. 2Geriatric Division. Hospital Italiano of San Justo, AgustĒn Rocca. Buenos Aires. 3 Buenos Aires University School of Medicine. Buenos Aires. Argentina. 4Internal Medicine, Nephrology and Geriatrics. Salamanca University. Salamanca. Spain
Rev Electron Biomed / Electron J Biomed 2014;2:16-23.
Comment of the reviewer Prof. Margarita Murgieri, MD. PhD (USAL). P Geriatrician. Director of Medicine in Facultad de Ciencias de la Salud. University of Mor¾n. Argentina
Comment of the reviewer Prof. Margarita Murgieri, MD. PhD (USAL). P Geriatrician. Director of Medicine in Facultad de Ciencias de la Salud. University of Mor¾n. Argentina
Comment of the reviewer Prof. Julio Nemerovsky, MD. Internal Medicine and Geriatrics. Professor of Geriatrics in Barcel¾ and Maim¾nides Universities. Argentina.
RESUMEN:
Objetivos: Este trabajo consiste en un anßlisis comparativo de salud, fragilidad y envejecimiento en personas de edad con y sin medios de subsistencia.
Material y Mķtodos: Poblaci¾n objetivo fueron las personas mayores de 50 a±os de edad, Grupo de Intervenci¾n tuvo el estatus socio-econ¾mico mßs bajo. Grupo de Control pertenece un grupo de clase social mßs elevada que viven en una poblaci¾n urbana con todos los recursos materiales disponibles.
Resultados: Los datos analizados corresponden a una muestra de 448 personas. La comparaci¾n entre ambos grupos no mostr¾ diferencias significativas.
Conclusiones: En nuestra observaci¾n, las poblaciones expuestas a ambientes hostiles prueban durante dķcadas que son funcionalmente aptas para defenderse de ellos.
PALABRAS CLAVE: Ancianos. Estado funcional. Bajos ingresos. Fragilidad.
SUMMARY:
Objectives: This work is a comparative analysis of health capital, frailty and ageing among old people with and without means of support.
Material and Methods: Target population are individuals older than 50 years old, Intervention Group have lower socio-economic status and live in slums. Control Group belong to a higher social clas living in an urban population with all the material resources.
Results: The data analyzed corresponds to a sample of 448 people. Comparison between both groups was not rendered as significant.
Conclusions: In Our observation, populations exposed to hostile environments evidence for decades to be functionally apt to defend themselves from it.
KEYWORDS: Old people. Functional state. Low income. Frailty
INTRODUCTION
Understanding ageing requires consideration of a person's background, the environment where they were born and grew up, the circumstances that they had to face the biological phenotype developed as a starting point1-4. To this, is added the environmental, social, cultural, economic, psychological and cognitive aspects that determine the possibility of ageing better or worse in relation to homeostatic biological and functional responses. This in turn will influence the degree of life expectancy they can expect5-11. Aged people have better health conditions and function than 30 years ago12-14.
As in most developed and developing countries, the Argentine Republic (RA) has a growing elderly population and now 10% of its population is older than 65 years old. Life expectancy at birth is 76 years and even at age 60 years, life expectancy is now 19.9 years (17.4 for men and 22.3 years for women). According to the projections of INDEC (the National Institute of Population Statistics and Census)15-16, the number of people older than 60 years is forecast to rise from 5.8 million (14.4% of the total population) in 2010 to 6.4 (15.2%) by 2015.
Similarly, the number of people aged older than 80 is projected to rise from 2% to 2.5% in the same period. Poverty among older people in Argentina has decreased from 27% in 2003 to 3.5% in 2009, whilst homelessness in the old has fallen in the same period from 10% to 0.8%. However, there are still certain areas that behave demographically and socially like third world countries. Here, the percentage of elderly people is much lower than the national average, with few people older than75 years according to census data17-18. Although there is little published data, experts say that health, environmental and social conditions of these old people are poor, insufficient or dysfunctional19-21. The current study aims to explore what it is like to age in such bad socio-environmental conditions and to compare this with the experiences of elderly people in more supportive environments.
MATERIAL AND METHODS
The study was conducted between May 2010 until March 2012 in two different communities of Buenos Aires, one a slum area or "villas miseria", characterized by people with little socio-economic means of support and a low level of education (lower support or LS group) and the other a more prosperous suburb of the city, inhabited by those with higher income and education (higher support or HS group). All the people included in the LS group had lived in the same district since they were born. Potential candidates to be interviewed were identified from census data.
Those eligible for inclusion were of either gender and aged 50 years or more. None in the LS group were to have private medical insurance or a privileged retirement plan and none in the HS group were to have been admitted to hospital in the year before the survey. Temporary residents or those who had lived in the area for less than a year were excluded. In the HS group there were 28,000 eligible subjects and so 200 were randomly selected.
Participants were interviewed by doctors who were part of the Family and Community Medicine Service of the Hospital Italiano de Buenos Aires and trained in the use of the study questionnaire and assessment measures. Those in the LS group tended to be suspicious of strangers and so were initially seen and consented in the presence of a community leader in a local Primary Health Care Centre. Those in the HS group were consented in their own home. Three interviews followed, all conducted at home and so allowing for observation and analysis to corroborate what was said. Partners or other cohabitants usually accompanied participants.
The first interview collected demographic, social and environmental data, medical background and self-perception of health. During the second interview, anthropometric measurements (weight and height) were recorded and blood taken for laboratory analysis. At a third interview, the functional assessments were carried out. These included the Mini Mental State Examination [22] to evaluate cognitive state, the physical evaluation scale of the quality of life questionnaire SF-12 [23], test of Gait Speed, the Short Physical Performance Battery (SPPB) of physical performance [24-27] and the Fried Frailty Measure [28-33], with hand grip strength measured using a dynamometer BASELINE, Inc. Corp., EUA [34, 35, 36].
All the data were entered into a database designed using the web program LimeSurvey (http://hardineros.com.ar/liveform/index.). Weight and height were used for the automatic calculation of Body Mass Index.
Ethical considerations The study was carried out with the authorization of community leaders and health and church staff who work with them. Individual consent was obtained from participants (or proxy consent if they showed signs of cognitive deterioration). Confidentiality and pseudo-anonymity of data were maintained by the evaluating doctor allocating an individual identity number to each participant. Conformity with the principles of the Declaration of Helsinski was maintained at all times.
Analysis of the data:
The data were organized into four age groups (50-59, 60-69, 70-79 and 80 years or more) and the two groups (LS and HS) were compared using Chi square or the exact test of Fisher, as appropriate, for categorical variables and Student t test for continuous variables with a normal distribution, or the Wilcoxon-Mann-Whitney test for the variables with a skewed distribution. The test of Kruskal-Wallis and analysis of variance (ANOVA) were used to compare continuous variables among two or more groups. A value of p <0.05 was considered significant.
RESULTS
Of the 5001 people living in the LS district, 400 were aged 50 years or more and 262 were eligible for and consented to inclusion in the study. Of the 28000 eligible people in the HS group 200 were randomly selected and 189 of these consented to inclusion.
Fifteen interviews were not included in the final analysis due to incomplete or inconsistent data. Characteristics of participants (age, sex, education, employment, home circumstances, finances, smoking history and medical and drug history) in the two groups are shown in Table 1.
Table 1: general aspects (n=448)
|
|
LS |
HS |
P |
|
n
= 262 |
n
= 186 |
(<
0.05) |
|
|
Age
(years) |
63
[56-76] |
72
[63-80] |
<Ā 0,001 |
|
People over 65 yrs. |
113
(43) |
123
(66) |
<Ā 0,001 |
|
Females |
153
(58) |
118
(63) |
0,28 |
|
Less than 7 yrs. of education |
218
(83) |
44
(18) |
<Ā 0,001 |
|
Low income (<Ar$1000) |
249
(95) |
0
(0) |
<Ā 0,001 |
|
Not working |
225 (86) |
113 (61) |
<
0.0001 |
|
Living alone |
24 (9) |
45 (24) |
- |
The anthropometric and functional results are shown in table 2. When these results are analysed comparing both groups, a significance is observed only in the Mini Mental test, with a cut-off point of 24 (maximum 30) equivalent in Argentina to a 7 year education.
Table 2. Tests performed and their results
(n = 448)
|
|
Cases n
= 262 |
Controls |
P |
|
IMC |
25
[22-26] |
25
[23-27] |
0,28 |
|
>
29 |
18
(7) |
20
(11) |
0,14 |
|
<
21 |
32
(12) |
13
(7) |
0,07 |
|
MMSE |
24
[22-27] |
28
[26-30] |
<Ā 0,001 |
|
>
24 |
112
(43) |
147
(79) |
<Ā 0,001 |
|
Dinamometry
(> 20% FM loss) |
46
(18) |
30
(16) |
0,69 |
|
SPPB
(> 12) |
137
(52) |
107
(57) |
0,27 |
|
SF-12 |
10
[6-12] |
10
[7-12] |
0,73 |
|
Gate
rate |
1
[0,8-1] |
1
[0,9-1] |
0,61 |
|
Fried
(>2,5) |
69
(26) |
40
(21) |
0,24 |
When we analyzed the data comparing the age groups, and between both populations studied, the results obtained showed: In the Mini Mental test there was a bigger difference between 70 and 79 years old, and a slow decrease with age (p<0.001) Figure 1.
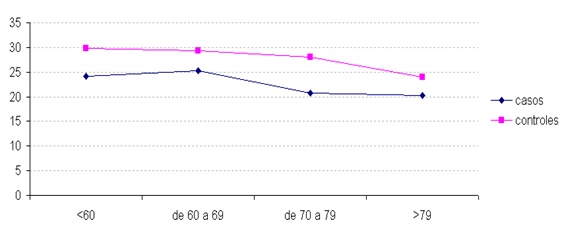
The decrease was observed previously in the intervention group, and approaching 80 years old in the control group, with a tendency to level up as the age increases. There is a marked difference in the Body Mass Index when observed in each group separately particularly in the 7th decade (p =0.009). A slight tendency to obesity was also observed in the control group, which again tends to disappear in this last group, in people older than 79 since they frequently lose weight
In the SPPB when we opened the analysis according to age group we observed a (p< 0.001) at 7th decade, and with the same tendency to level up in people older than 79. When we measured the gait speed with a cut-off point of 1 second per meter of speed, significance was noted between 70ª and 79ª. (p<0.001), but with minor differences in all the age groups in favor of a better functional state in the control group, as well as a slight tendency to narrow after 80 years old
The perception of the physical health state on the test SF-12 did not show any difference between both groups in the age extremes, (<60¬. and >79¬.) although in the latter the value tended to cross in favor of the LS group. An increasing significant difference (p<0.001) was also observed between 60 and 80 years old. When we broke down the answers according to age group and sex, we noted that in the intervention group, women perceive their health as worse from 79ª years of age. In the intervention group or cases, women perceive their health as progressively worse as their age advances. On the Hand Grip there wasn't any significance difference between both groups. Dividing into age, we can observe that in people older than 79, there is a marked loss of muscular strength in the control group and viceversa, in any of the cases in people younger than 60.
In the LS group, the group with less loss of muscular strength is the one between 70ª and 79ª years of age while the others are more similar regarding performance. The relationship between loss of muscular strength with the corrected body mass according to height and sex shows us that in the LS group there is a higher loss of strength in both genders when the BMI is lower than 21 (malnourished), and a higher loss with any weight in the case of the women group, with a big difference in obese women which can make us infer a case of sarcopenic obesity.
In the HS group, there is clear evidence of a high percentage (35%) in the malnourished group (BMI <21) in both genders alike. A big difference in all the women groups, which increases up to 35% of the population in the case of obese women (IMC > 30).
In Fragility evaluation according to the criteria of Linda Fried, the comparison between both groups was not rendered as significant, but when we divided them by gender as women get older they become more fragile in comparison to men. When separating both groups, beginning at 79 years both show a marked difference between both genders, while in the LS group this difference is repeated since earlier ages and it is still increasing. In the HS group the difference is seen after 79ª years of age. Figure 2.
The lab parameters obtained are expressed in Table 3. A significance is observed in serum values of albumina, which is higher in this case in the HS group (94% of the population), in the hemoglobin values, 88% of the population in the HS group had higher averages, and we observed that 25% of the HS had positive PCR (p<0.001).
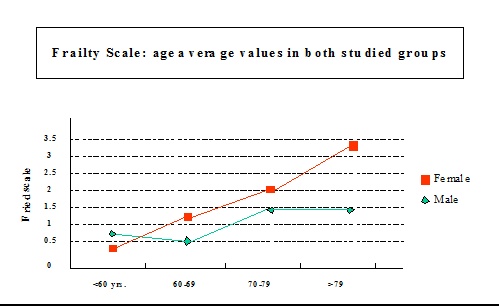
Table 3: Laboratory parameters
|
|
Cases n
= 262 |
Controls |
p |
|
Albumin
(>3-3.5) g/l |
218
(83) |
175
(94) |
<Ā 0,001 |
|
Cholesterol
mg/dl |
206
[185-230] |
218Ā [190-235] |
0,02 |
|
>240 |
38
(14) |
29
(16) |
0,75 |
|
<
160 |
16
(6) |
6
(3) |
0,16 |
|
HB
(male >12,5 and female >11,5) g/l |
172
(66) |
167
(88) |
<Ā 0,001 |
|
PCR |
66
(25) |
23
(12) |
<Ā 0,001 |
|
Creatinine
(>1,2) mg/dl |
34
(13) |
26
(14) |
0,76 |
|
Glycemia
(>126) mg/dl |
20
(8) |
19
(10) |
0,33 |
DISCUSSION
The higher income and education group was a little older, with an age range of between 63 and 80. There was the same proportion of women in both groups, probably due to a higher mortality rate in older adults who live in extreme conditions. The high proportion of people with less than 7 years of education in the LS group is explained by their limited access to education, child labour, and the fact that the majority of them come from a rural background. In these periurban settlements the majority of people do not work, they have informal employment or welfare provided by the state.
And since many times the elderly family member is the only one who has a retirement or pension income, they usually do not live alone. The other possible explanation, is that in this group cohabitation is more frequent, sometimes with more than one generation, due to the housing deficit. They usually live in one bedroom rudimentary houses or studios sharing the space with other generations of the family.
The significance in the Mini Mental test, with a cut-off point of 24 (maximum 30) is equivalent in Argentina to a 7 year education, which could be explained due to the fact that in the intervention group the majority of the people had been in school for less than that seven years total. When the data is analyzed comparing it between both populations studied, the results obtained show us, a higher difference in the 70 and 79 year old group, as well as a slow decrease as age advances (p<0.001). The fall is observed first in the LS group and approaching 80 years old in the HS group, with a tendency to level up as age progresses. The physiological ageing factor would impact in the same way after reaching 80¬ years of age independently of the risk factors. Naturally, the LS group performs less from an early age due to what has already been explained. Fig.1
The Body Mass Index in both groups as a whole did not render a significant statistical result, in the SPPB it is observed that when we opened the analysis according to age group (< 0.001) the same tendency to level up in people older than 79 years old appeared. When gait speed was measured with a cut-off point of 1 second per meter of speed, no significance was again between both groups. The perception of the physical health state in the test SF-12 did not show any difference in the two extreme groups of age (<60ª. y >79ª.) although in the latter it tended to cross with the value in favor of the case groups.
When we broke into the answers in each group according to age groups and sex, we realized that in the intervention group women perceived their health as worse from 79ª years of age. It is worth noticing that muscular strength measured with the hand does not show any significance of p between both groups globally. Dividing them into ages we can observe that in people older than 79ª a marked loss of muscular strength can be evidenced in the control group, and viceversa in none of the cases of people under 60. In the intervention group, interestingly enough, we see that the group with less loss of muscular strength is the one between 70ª and 79ª years of age and that the rest are similar regarding performance.
In the frailty evaluation, when we sorted the people by gender, women become more fragile as age progresses in comparison to men. When we divided both analysis groups, beginning at 79 both show a clear difference in both genders, but in the case group this difference appears from early ages and increases both. This correlates with the lower perception of physical wellbeing in women belonging to the most vulnerable group Fig 6. The significance in serum values of albumina, higher in this case in the control group (94% of the population), in the case of hemoglobin values 88% of the population of the control group presented higher averages, which implies a better nutritional state, and the observation that 25% of the intervention cases had positive PCR (p<0.001), implies a higher pro-inflammatory state in vulnerable populations. Table 3
Limitations of the study
This is a field study carried out in risk areas for the interviewers where questions were not supposed to create rejection or sensitivity feeling they were being asked questions for other reasons that are not the scientific ones explained. Its value lies on being the first geriatric evaluation performed in thesepopulation in Argentina.
It is not a randomized study of two comparative samples, it is descriptive and observational and above all things its "n" is small to understand the data found. Ideally, the study which would definitely give us the more significant information should be cohort of longitudinal follow-up through the life of the enrolled subjects and should last as long as the investigator desire.
CONCLUSION
Probably, we only found the survivors of the LS group, who surprised us with their functional state despite not having been educated, and living with little income under the poverty line, but as their age progressed the deterioration is higher and thus the difference with the people who have access to private health care is more evident.
A sort of social resilience is what makes the fittest survive in the worst conditions; many of them are even the main support of three or more generations. It is true that not many 85 year old subjects were found in the sample, and that there were older adults in the HS group, which is probably linked to a life expectancy of 70 years old for both sexes at the time of birth in this population (LS)17, and 78 years old in the HS group.
We believe that the data found in this study speaks for itself since the adverse socio economic and sanitary conditions of a person throughout their lives, condition the person to be more vulnerable. It is also true that the people who survive that hostile environment, evidence for decades, to be functionally apt to defend themselves from it.
Conflict of interest: No conflicts declared
REFERENCES
1.- Macinko J, Starfield B. The utility of social capital in research on health determinants. Milbank. 2001; 79(3): 387-427
2.- Kawachi I, Kennedy B. The relationship of income inequality to mortality: does the choice of indicator matter? Soc Sci Med. 1997; 45(7): 1121-1127
3.- Kawachi I. Social capital, income inequality, and mortality. Am J Public Health. 1997; 87(9): 1491-1498.
4.- Guimaraes R.M. Health capital, life course and ageing. Gerontology. 2007; 53(2): 96-101.
5.- Freedman V, Martin L, Schoeni R. Recent trends in disability and functioning among older adults in the United States: a systematic review. JAMA. 2002; 288(24): 3137-3146.
6.- Freedman V. Declines in late-life disability: the role of early- and mid-life factors. Soc Sci Med. 2008; 66(7): 1588-1602.
7.- Crimmins E. Trends in the health of the elderly. Annu Rev Public Health. 2004; 25: 79-98.
8.- Crimmins E, Kim J, Seeman T. Poverty and biological risk: the earlier "aging" of the poor. J Gerontol A Biol Sci Med Sci. 2009; 64(2): 286-292.
9.- Crimmins M. Changes in biological markers of health: older Americans in the 1990s. J Gerontol A Biol Sci Med Sci. 2005; 60(11): 1409-1413.
10.- Marmot M. The Status Syndrome. New York. Times Books. 2004
11.- Marmot M, Brunner S, Hemingway H. Relative contribution of early life and adult socioeconomic factors to adult morbidity in the Whitehall II study J Epidemiol Community Health. 2001; 55: 301-307
12.- Jauregui J, La Valle R, Musso CG, Kaplan R. Multidimentional assessment of old people of very low income in Argentina. Electron J Biomed 2011;1:19-27
13.- Jauregui J, Kaplan R, Musso CG. Geriatric Care and Gerontological Research in Argentina. Reviews in Clinical Gerontology. 2011; 21(03): 270-275.
14.- Parker M, Thorslund M. Health trends in the elderly population: getting better and getting worse. Gerontologist. 2007; 47(2): 150-158.
15.- INDEC. Encuesta permanente de hogares y Censos. Buenos Aires. 2005
16.- INDEC. General Characteristics. Buenos Aires.2001
17.- INDEC. B series, selected characteristics. Federal District. INDEC (Inst. Nac. de Estadistica y censos): Buenos Aires. 2001
18.- INDEC-CELADE. Projections of population according to gender and age; 1990-2010 Series 2, Demographic Analysis. Buenos Aires. 2001
19.- Vaillant G, Mukamal K. Successful aging. Am J Psychiatry. 2001; 158(6): 839-847
20.- Smith G. Income inequality and mortality: why are they related? BMJ. 1996; 312: 987-988.
21.- Smith G, Lynch J. Commentary: Social capital, social epidemiology and disease aetiology. Int J Epidemiol. 2004. 33(4): 691-700
22.- McKhann G. Clinical diagnosis of Alzheimer's disease: report of the NINCDS-ADRDA Work Group under the auspices of Department of Health and Human Services Task Force on Alzheimer's Disease. Neurology, 1984; 34(7): 939-944
23.- Monteagudo Piqueras O. Valores de referencia de la poblaci¾n diabķtica para la versi¾n espa±ola del SF-12v2. Gaceta Sanitaria. 2009; 23(6): 526-532
24.- Guralnik J. Understanding the relationship between disease and disability. J Am Geriatr Soc. 1994; 42(10): 1128-1129.
25.- Guralnik, J. Validation and use of performance measures of functioning in a non-disabled older population: MacArthur studies of successful aging. Aging (Milano). 1994; 6(6): 410-419.
26.- Guralnik, J. A short physical performance battery assessing lower extremity function: association with self-reported disability and prediction of mortality and nursing home admission. J Gerontol. 1994; 49(2): M85-94.
27.- Guralnik J, Winograd C. Physical performance measures in the assessment of older persons. Aging (Milano). 1994; 6(5): 303-305.
28.- Fried L. Untangling the concepts of disability, frailty, and comorbidity: implications for improved targeting and care. J Gerontol A Biol Sci Med Sci. 2004; 59(3): 255-263.
29.- Fried L. Risk factors for 5-year mortality in older adults: the Cardiovascular Health Study. JAMA. 1998; 279(8): 585-92
30.- Fried L. Diagnosis of illness presentation in the elderly. J Am Geriatr Soc. 1991; 39(2):117-23
31.- Fried L. Frailty in older adults: evidence for a phenotype. J Gerontol A Biol Sci Med Sci. 2001; 56(3): M146-56
32.- Linda P, Fried L. Frailty in older adults: Evidence for a phenotype. Journal of Gerontology Medical Sciences. 2001; 56A: M146-M156.
33.- Walston J, Hadley EC, Ferrucci L, Guralnik JM, Newman AB, Studenski SA, Ershler WB, Harris T, Fried LP. Research agenda for frailty in older adults: toward a better understanding of physiology andetiology: summary fromthe American Geriatrics Society/National Institute on Aging ResearchConference on Frailty in Older Adults. J Am Geriatr Soc. 2006;54(6):991-1001.
34.- Arnold C. The reliability and validity of handheld dynamometry for the measurement of lower-extremity muscle strength in older adults. J Strength Cond Res; 24(3): 815-824.
35.- Woods JL, Iuliano-Burns S, King SJ, Strauss BJ, Walker KZ. Poor physical function in elderly women in low-level aged care is related to muscle strengthrather than to measures of sarcopenia. Clin Interv Aging. 2011;6:67-76
36.- Pua Y. Allomeric Analysis in Physical Performance Measures in Older Adults. Physichal Therapy. 2006; 83: 1263-1270.
37.- Isaacs B, Neville I. The Survival of the Unfittest. London. The Lavenham Press. 1972
CORRESPONDENCE:
Josķ R. Jauregui, MD. PhD.
Tte. Gral. Juan Domingo Per¾n 4272, zip code C1181ACH,
Ciudad Aut¾noma de Buenos Aires
Argentina.
E-mail: jose.jauregui @ hospitalitaliano.org.ar